The Interior Design KPI Dashboard in Power BI is a must-have tool for interior designers who want to monitor the success of their projects in real-time. By using this powerful dashboard, interior design firms can efficiently track crucial metrics such as budget adherence, project timelines, client satisfaction, and resource allocation. This tool integrates seamlessly with Power BI, a leading business analytics platform, enabling design professionals to visualize data in an engaging and interactive way, ensuring they stay on top of every aspect of their projects.
Key Features of the Interior Design KPI Dashboard in Power BI
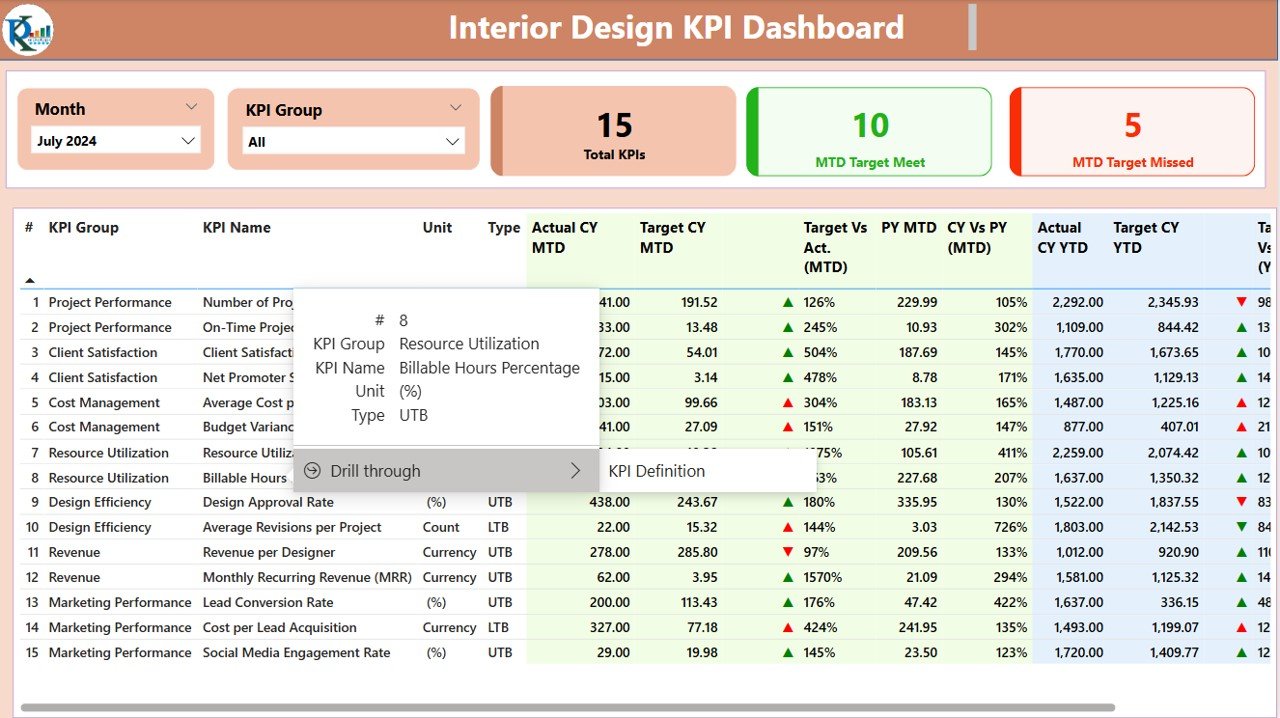
The Interior Design KPI Dashboard in Power BI is designed to provide a comprehensive overview of a project’s key performance indicators. Below are the core features of this dynamic dashboard:
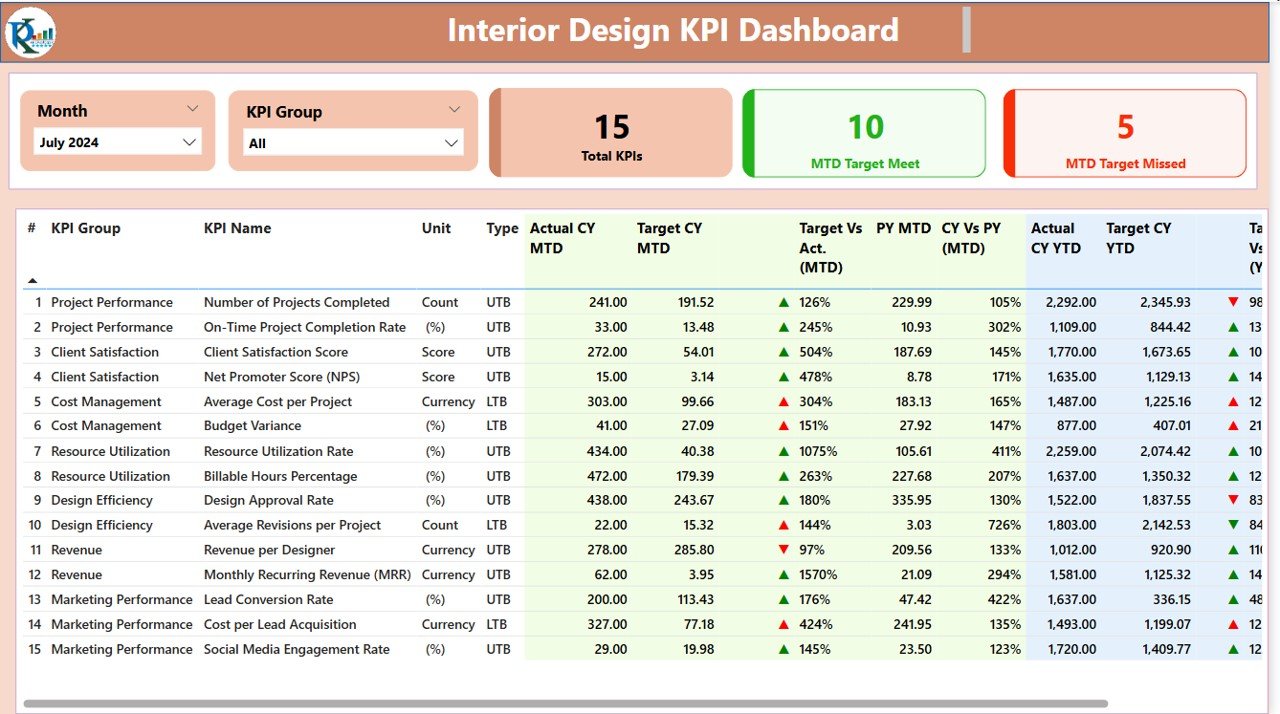
Summary Page:
- KPI Overview Cards: Quickly view key statistics like the total number of KPIs, the number of KPIs meeting or missing targets (MTD and YTD).
- Detailed KPI Table: Displays key metrics such as actual vs. target numbers for both MTD and YTD, KPI definitions, and comparisons with the previous year.
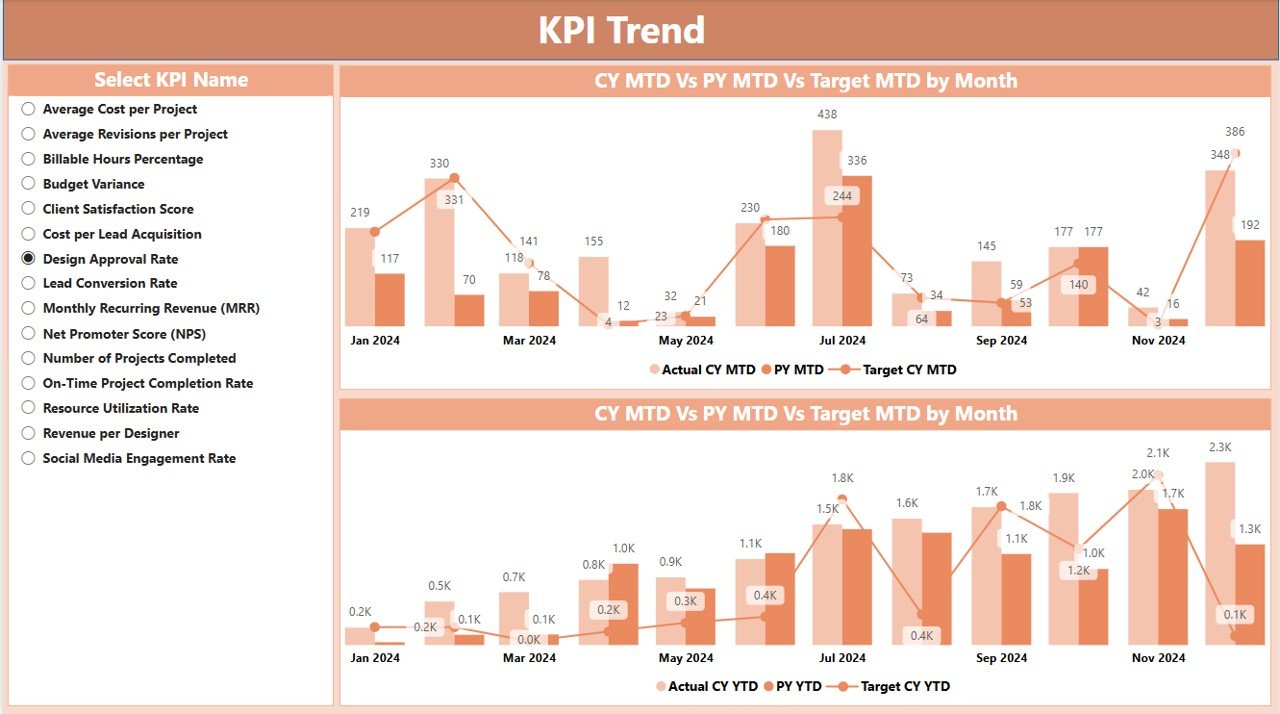
KPI Trend Page:
- Combo Charts: Visualize trends in actual numbers, targets, and previous year data for MTD and YTD KPIs.
- KPI Slicers: Filter and drill down into specific KPIs for a more granular view of performance over time.
KPI Definition Page:
- Detailed KPI Information: View formula definitions and detailed KPI descriptions with a simple drill-through option from the Summary Page.
Read the detailed blog post