The Architecture KPI Dashboard in Power BI is a powerful tool for architecture firms and project managers who need to track the performance of their projects. With its ability to aggregate data from various sources like Excel, this dashboard offers real-time insights and enables informed decision-making, helping architectural teams stay on schedule, within budget, and aligned with client expectations.
The dashboard simplifies the process of monitoring key performance indicators (KPIs) such as budget adherence, project timelines, resource utilization, and client satisfaction. By consolidating these metrics into one comprehensive dashboard, Power BI makes it easy to analyze and optimize every aspect of your architectural projects.
Key Features of the Architecture KPI Dashboard in Power BI
The Architecture KPI Dashboard in Power BI comes with several advanced features designed to streamline project management and performance tracking. Below are some of the key features that make this tool indispensable for architectural teams:
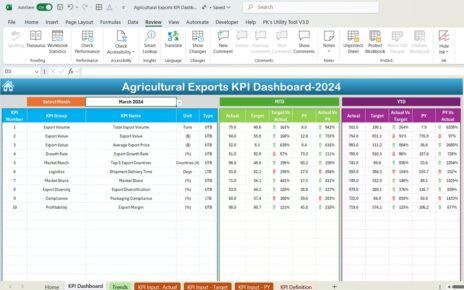
Summary Page: Centralized View of All Metrics
The Summary Page serves as the core of the dashboard, offering an overview of all KPIs. It includes:
Month and KPI Group Slicers: These slicers help filter data based on specific months and KPI groups, allowing for a more targeted view.
KPI Overview Cards: These cards display essential statistics such as:
- Total KPIs Count: Shows the total number of KPIs being tracked.
- MTD Target Meet Count: Displays the number of KPIs that met their target for the month-to-date.
- MTD Target Missed Count: Shows the number of KPIs that missed their targets for the month-to-date.

The summary also contains a detailed KPI table with key data such as the KPI name, actual vs. target values, and comparisons with previous year data. These metrics give project managers a clear snapshot of current performance.
KPI Trend Page: Visualize Data Over Time
The KPI Trend Page allows users to visualize trends in KPIs over different time periods. This page includes:
- Combo Charts: Visual representations of actual numbers, targets, and previous years’ data for both MTD and YTD metrics.
- KPI Name Slicer: Enables the selection of a specific KPI to track its performance over time.

This page helps identify trends and performance changes, enabling teams to take proactive measures when needed.
KPI Definition Page: Detailed KPI Insights
The KPI Definition Page offers in-depth information about each KPI. Hidden from the main view, this page can be accessed by drilling through from the Summary Page. It includes:

- Formula: The specific calculation used to determine each KPI.
- Definition: An explanation of what the KPI measures and how it impacts the overall project success.