Employee retention is one of the most significant challenges facing businesses today. A high turnover rate can be costly and disruptive to an organization. One of the best ways to manage this is through the use of an Employee Retention KPI Dashboard. This article will explore how an Employee Retention KPI Dashboard can help you monitor and improve your employee retention strategies, track key performance indicators (KPIs), and provide actionable insights for your HR team.
Key Features of the Employee Retention KPI Dashboard
This ready-to-use template includes several essential features to help businesses track and analyze their employee retention metrics effectively:
1. Home Sheet
The Home Sheet is the index of the dashboard. It provides quick access to all the other worksheets via six buttons. It serves as an easy starting point to navigate the entire dashboard.

2. Dashboard Sheet Tab
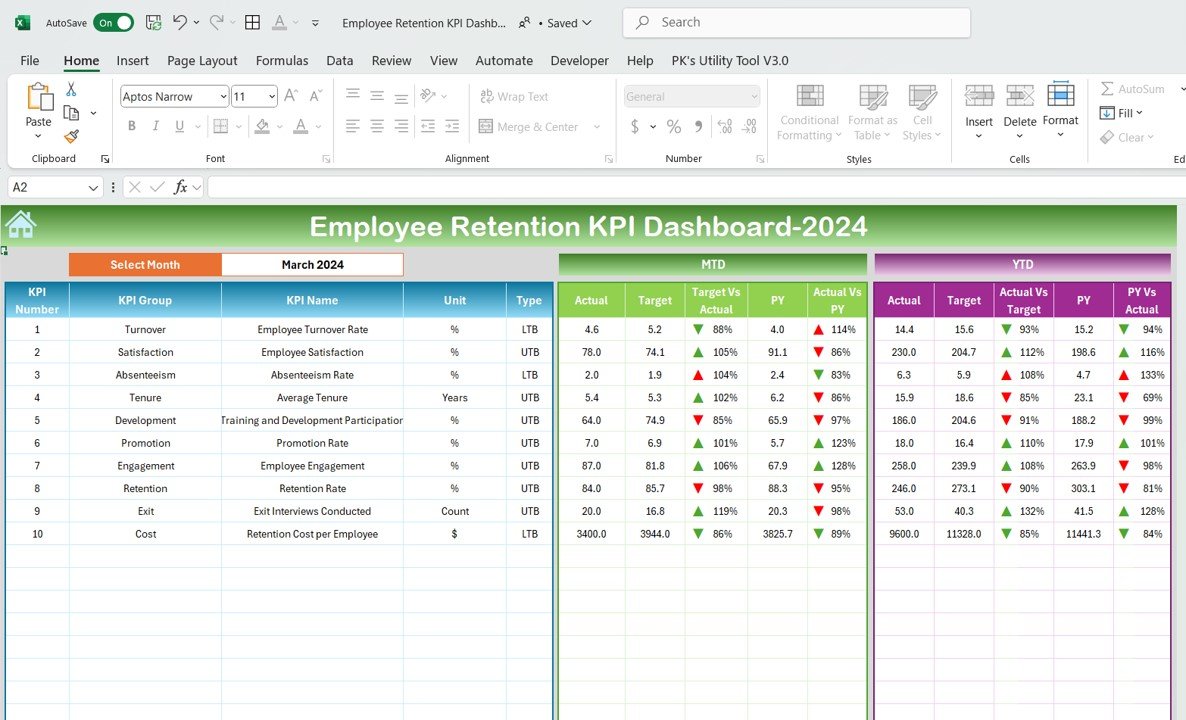
The Dashboard Sheet is where all the KPI data is displayed. It provides a snapshot of the key metrics for the selected month. Features include:
- Month Selector: You can select the month from a dropdown list, and the dashboard will automatically update all KPIs for that month.
- MTD and YTD Comparisons: View the Month-To-Date (MTD) and Year-To-Date (YTD) data for each KPI, alongside Target vs Actual and Previous Year (PY) vs Actual.
- Conditional Formatting: Arrows (up or down) highlight the differences between targets and actual performance.
3. KPI Trend Sheet Tab
This sheet allows you to visualize trends over time for each KPI. You can select any KPI from a dropdown, and the sheet will display:
- KPI Group: The category the KPI belongs to.
- Unit: The unit of measurement for the KPI.
- Type of KPI: Whether the KPI should be Lower the Better or Upper the Better.
- Formula & Definition: The formula used to calculate the KPI and a clear definition.

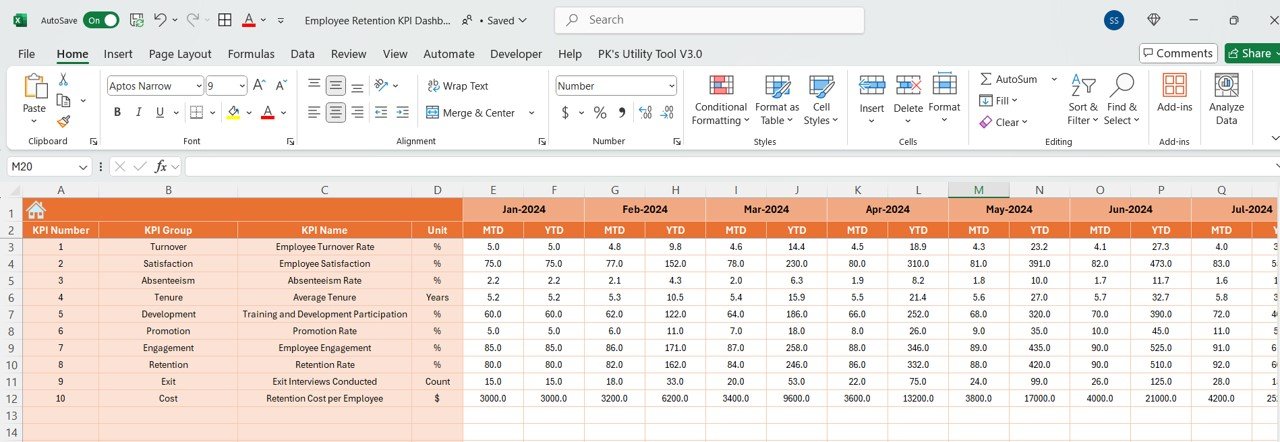
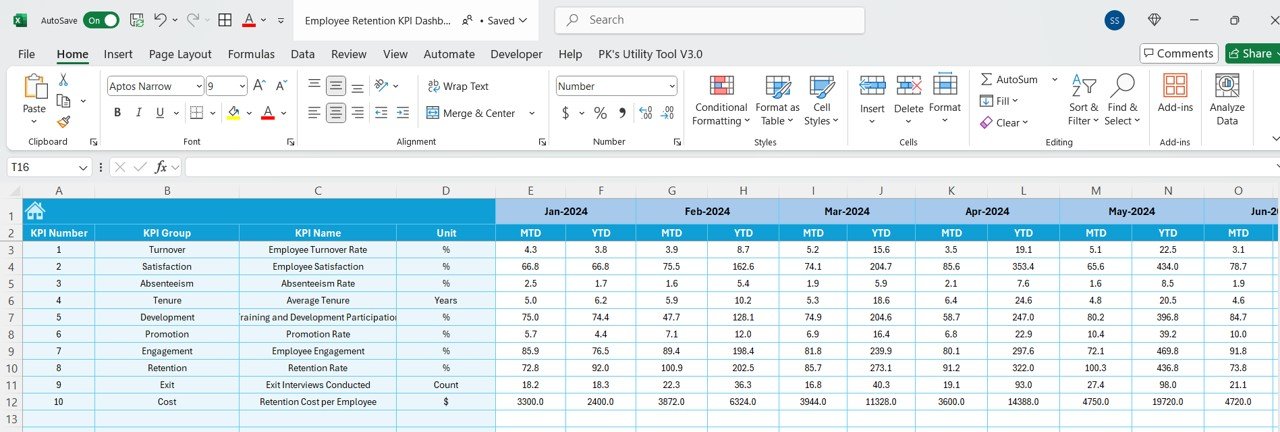
4. Actual Numbers Sheet Tab
This tab is where HR teams input the actual data for each KPI on a month-to-month basis. By entering the first month of the year, all subsequent data will automatically update.
5. Target Sheet Tab
In this sheet, HR teams enter target values for each KPI, both for MTD and YTD. These targets help assess whether the company is on track to meet its employee retention goals.
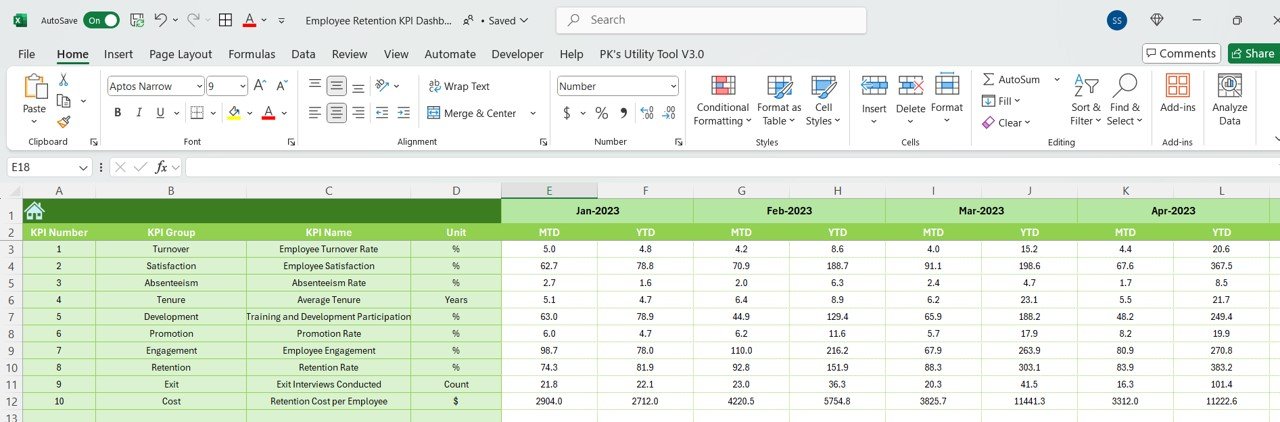
6. Previous Year Number Sheet Tab
Here, businesses can enter previous-year data, which helps compare current performance with last year’s data, identifying trends and areas for improvement.
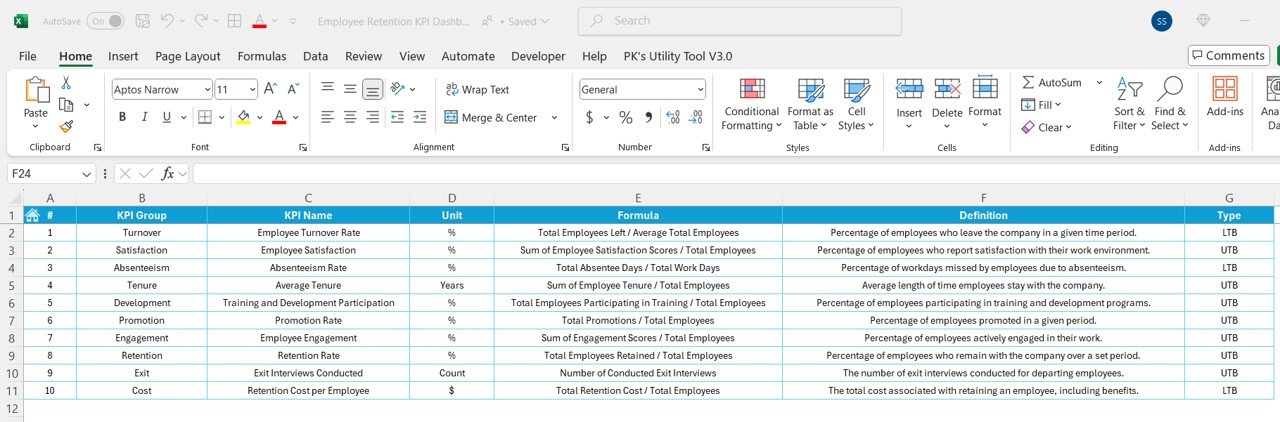
7. KPI Definition Sheet Tab
This sheet is a reference guide that lists each KPI’s name, group, unit, formula, and a clear definition. It helps users understand how each KPI is calculated and what it represents.