In today’s fast-paced and competitive SaaS landscape, effective tracking of business performance is essential for making informed decisions and staying ahead of the curve. The SaaS Business KPI Dashboard in Excel is an easy-to-use template designed to help SaaS businesses monitor key metrics such as revenue, customer retention, and performance efficiency. By utilizing this comprehensive dashboard, businesses can measure success, identify areas for improvement, and enhance data-driven decision-making.
Key Features of the SaaS Business KPI Dashboard in Excel
- User-Friendly Interface: The template includes a home sheet with quick access to all other sections, making navigation effortless for users of any experience level.

- Comprehensive Data Tracking: The dashboard provides a holistic view of your SaaS business by displaying Monthly Recurring Revenue (MRR), Customer Churn, Customer Lifetime Value (CLV), and other critical KPIs.
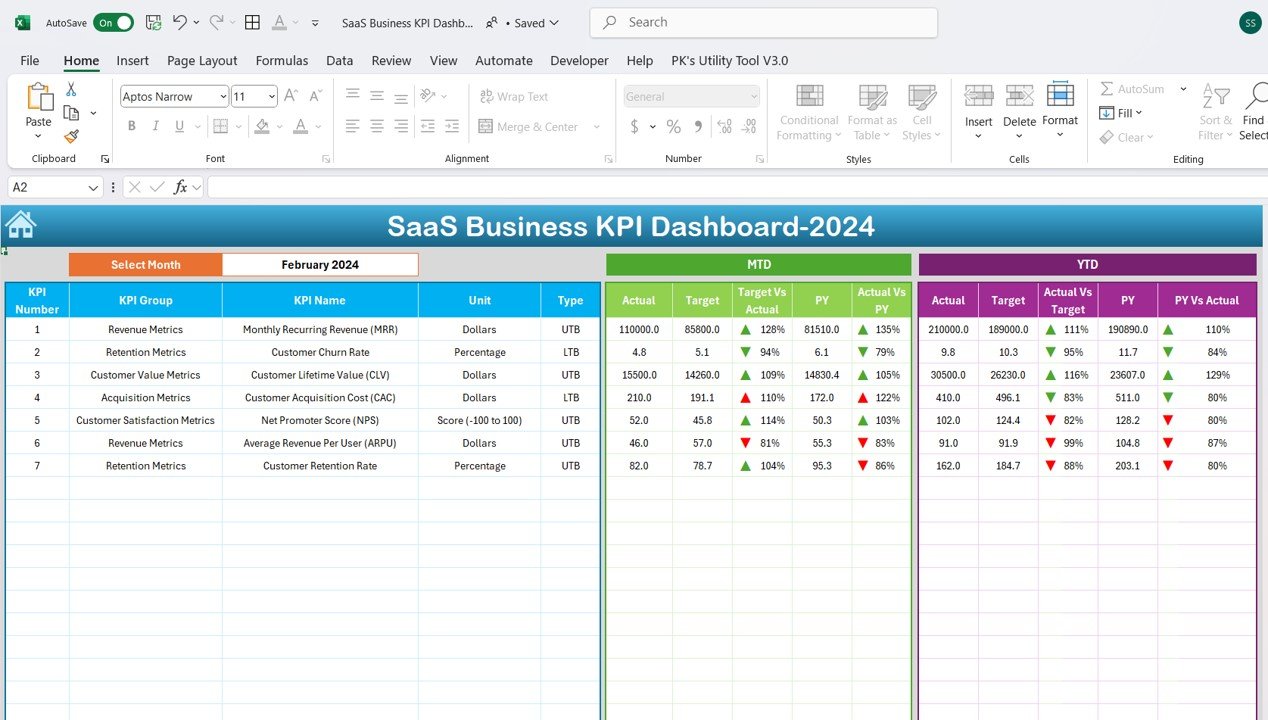
- Real-Time Updates: With automatic data updates, the dashboard ensures you always have the most up-to-date insights, allowing for timely action.
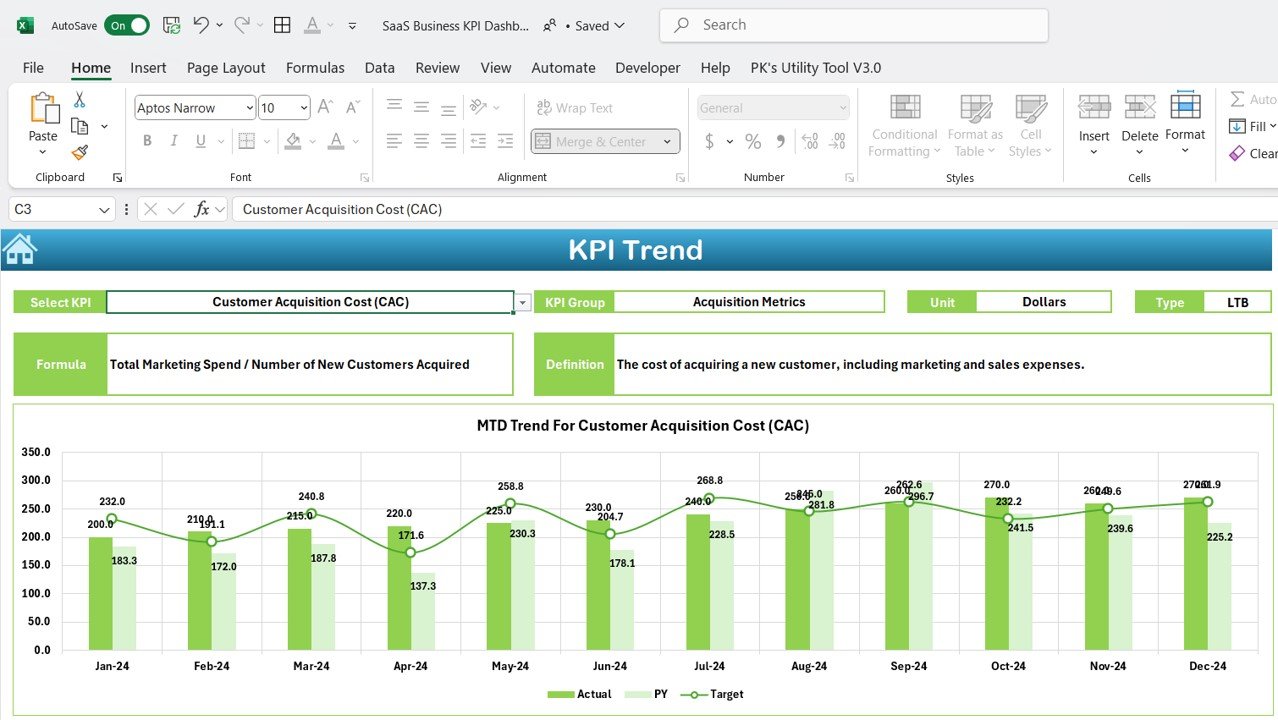
- Conditional Formatting: Visual indicators such as up/down arrows make it easy to compare actual performance against targets and previous years, helping you spot trends at a glance.
- Customizable Templates: The dashboard is fully customizable, enabling you to tailor it to your specific business needs, track additional KPIs, and set realistic performance targets.