The AR-VR Industry KPI Dashboard in Excel is a powerful tool designed to help businesses track key performance indicators (KPIs) in the fast-evolving world of augmented reality (AR) and virtual reality (VR). This template provides a structured approach to monitor performance, assess growth, and make data-driven decisions that align with business goals. With this dashboard, businesses can measure success across various AR-VR metrics, including user engagement, revenue, and customer retention, ensuring they stay competitive in this dynamic market.
Key Features of the AR-VR Industry KPI Dashboard in Excel
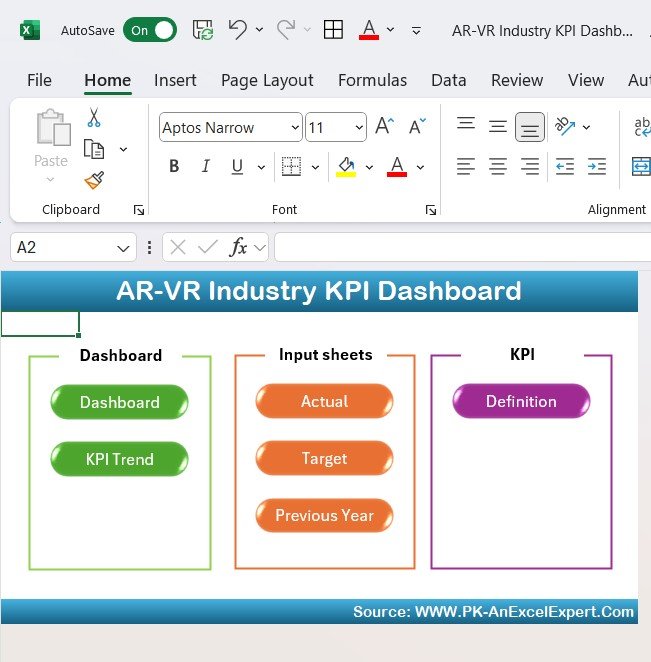
- Comprehensive Data Tracking: The dashboard includes 7 worksheets that track all important KPIs in one place, offering clear insights into business performance.
- Real-Time Updates: Automatic updates allow you to monitor key metrics with ease, providing the most current data for decision-making.
- Customizable Design: Tailor the dashboard to your specific needs by adjusting KPIs, targets, and layout, making it a flexible tool for diverse AR-VR businesses.
- Easy Navigation: The Home Sheet serves as an index with buttons for quick navigation to other sheets, ensuring easy access to the data you need.
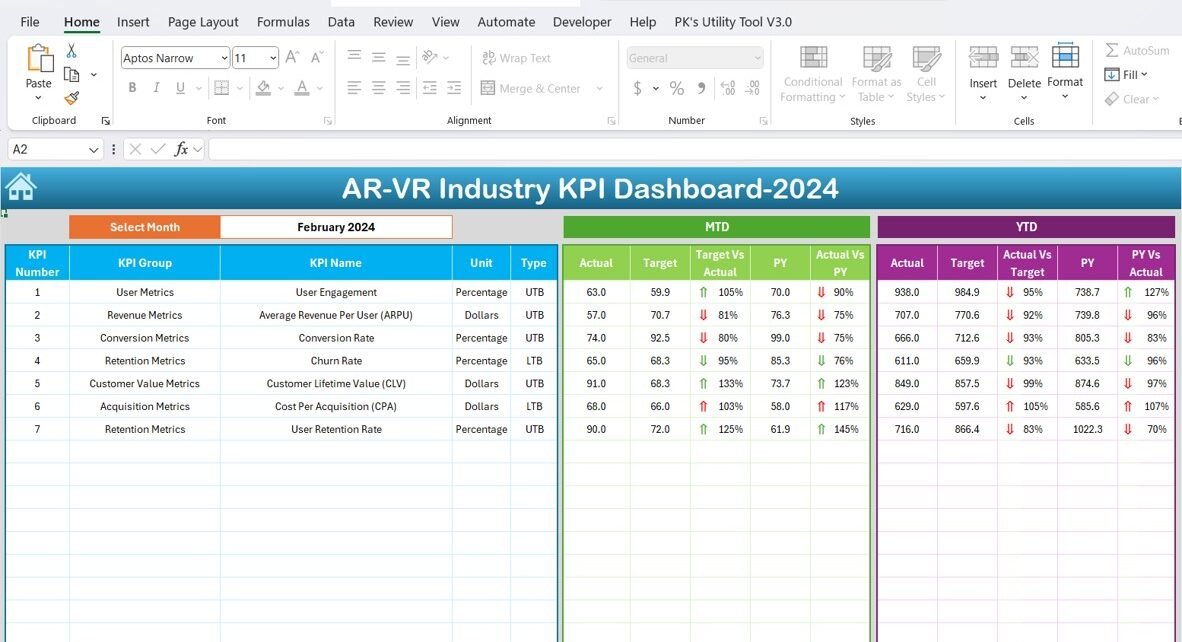
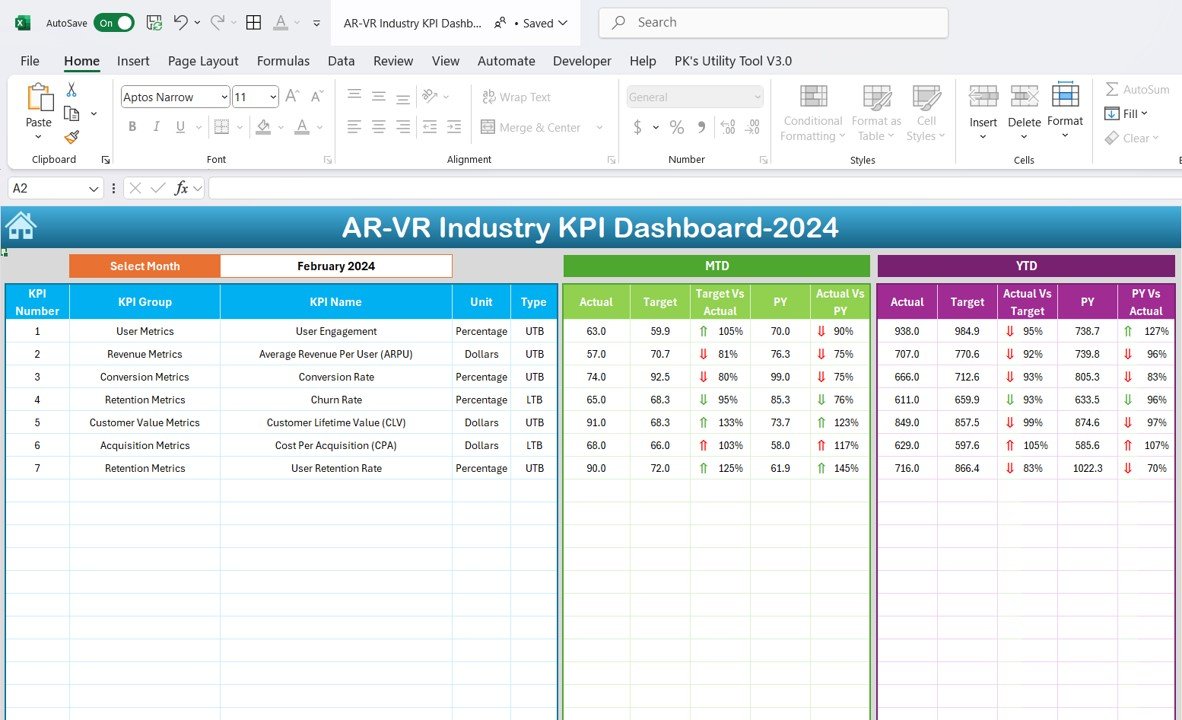
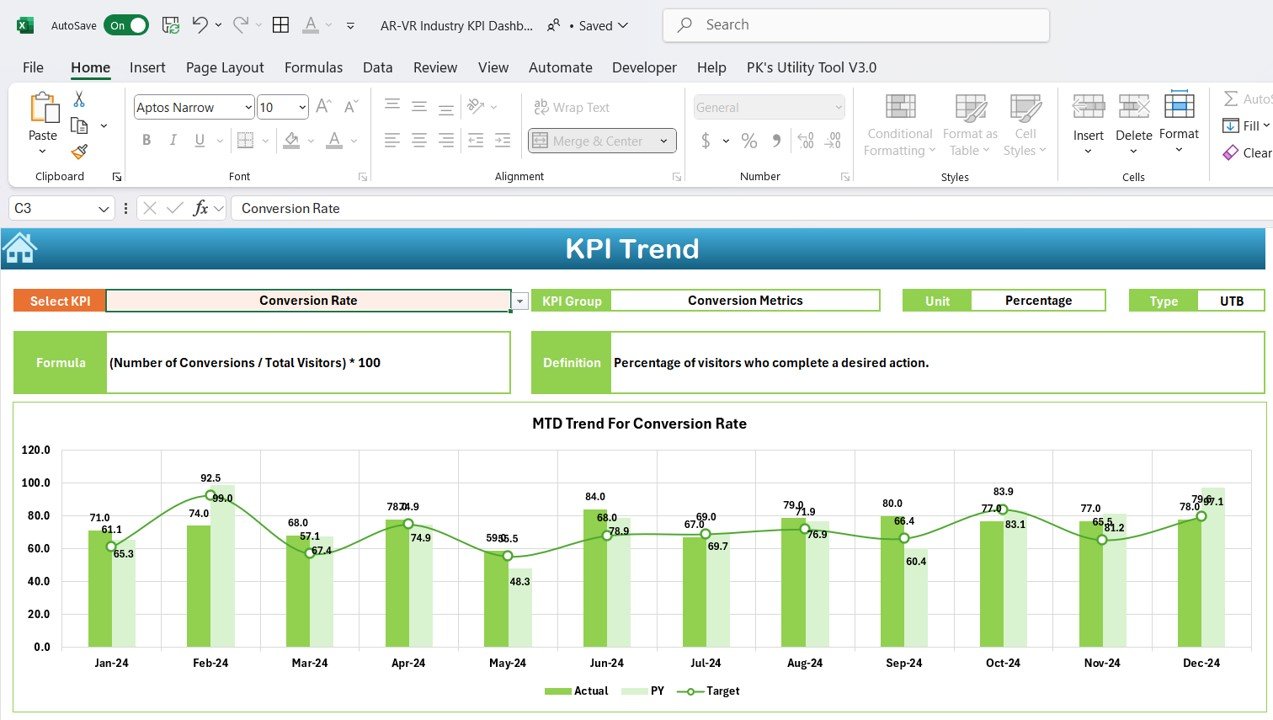
- Comparative Analysis: MTD, YTD, and previous year data are displayed side-by-side, making it easy to identify trends and performance gaps.
- Actionable Insights: Conditional formatting with up/down arrows highlights key insights, helping you quickly evaluate whether performance is on track.