The Smart Home Industry is rapidly growing, driven by advancements in automation, security, energy efficiency, and convenience. As the industry evolves, businesses require robust tools to track their performance effectively. The Smart Home Industry KPI Dashboard in Power BI is a powerful tool that integrates key performance indicators (KPIs) for smart home systems, enabling businesses to make informed decisions and drive operational improvements.
This dashboard allows businesses to track vital metrics such as energy usage, device uptime, and customer satisfaction through an intuitive interface. Let’s dive into the key features that make this dashboard an invaluable tool for smart home businesses.
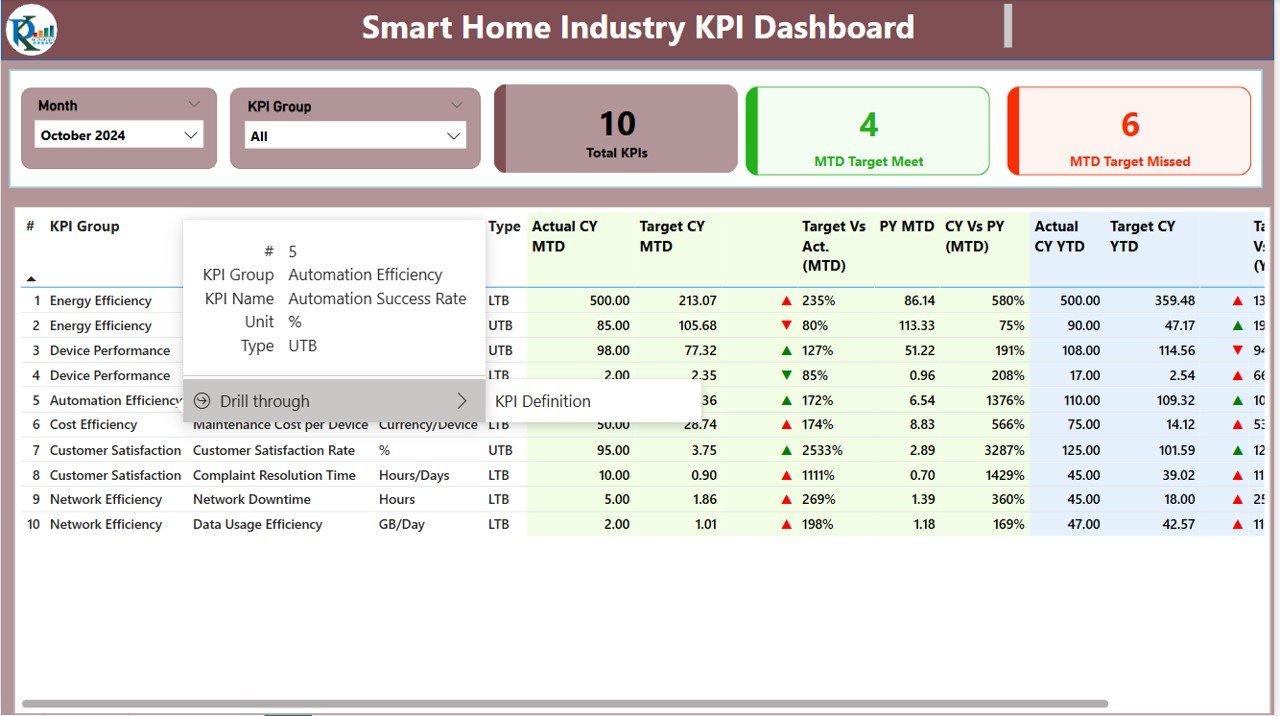
Key Features of the Smart Home Industry KPI Dashboard in Power BI
- Summary Page: This is the core of the dashboard, providing high-level insights and KPI data, including monthly targets, actual values, and comparisons with previous years. It also includes slicers for flexible data filtering.

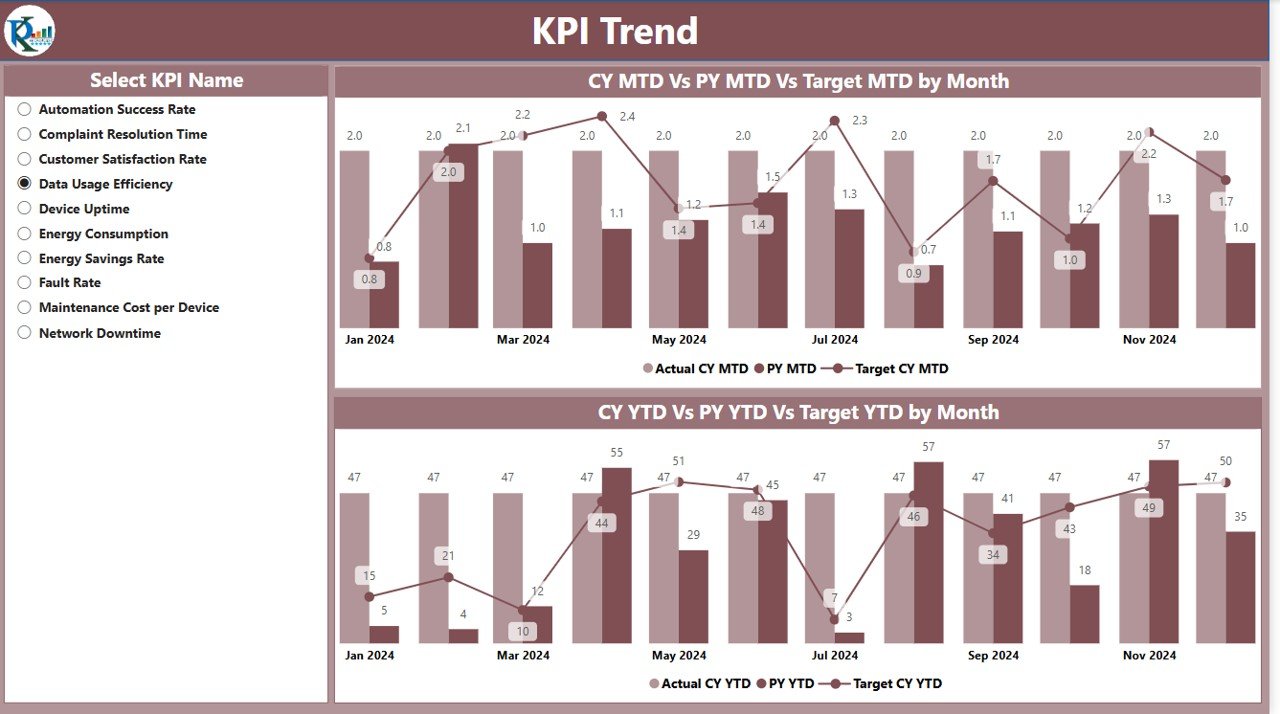
- KPI Trend Page: The KPI trend page provides detailed visualizations of KPI performance over time, making it easy to identify trends and areas for improvement.
- KPI Definition Page: A drill-through feature offering detailed information about each KPI, including its definition, calculation formula, and insights.