The DevOps KPI Dashboard in Excel is a ready-to-use, comprehensive solution designed to track and analyze key performance indicators (KPIs) for DevOps teams. This dashboard helps teams monitor their performance metrics, compare actual vs. target values, and gain valuable insights for continuous improvement. With an interactive interface and automated data visualization, this Excel template simplifies KPI tracking for better decision-making.
Key Features:
7 Comprehensive Worksheets:
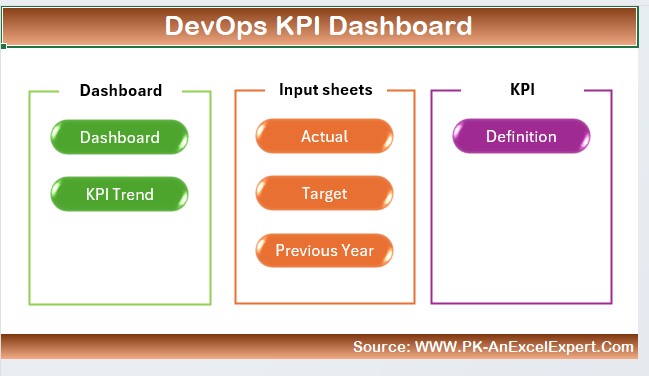
- Covers all essential DevOps KPIs, including actual, target, and historical data.
Interactive Dashboard:
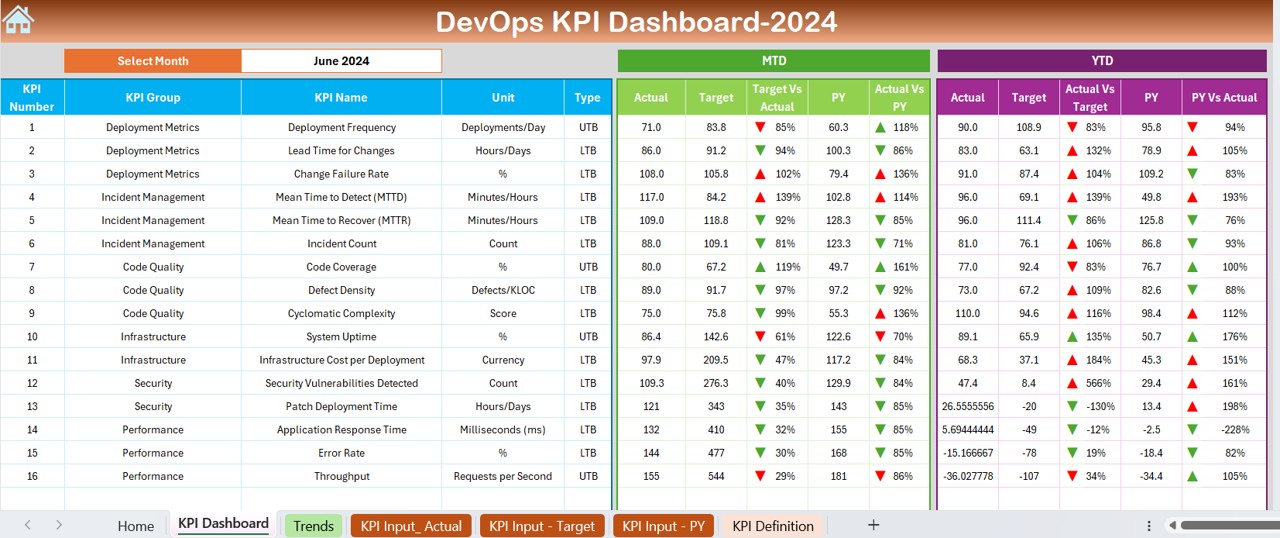
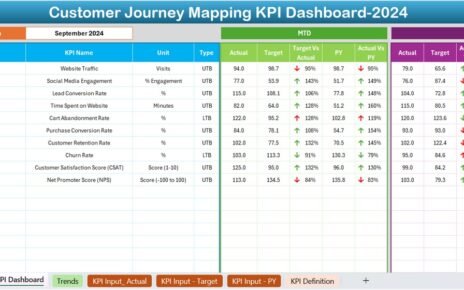
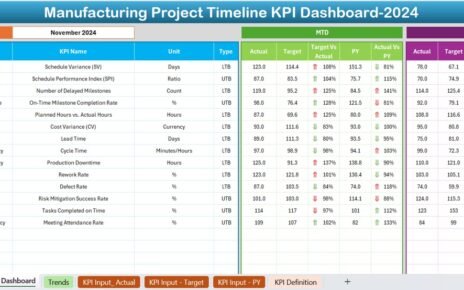
- Displays MTD and YTD trends, conditional formatting, and comparative analysis with up/down arrows.
Automated Data Input:
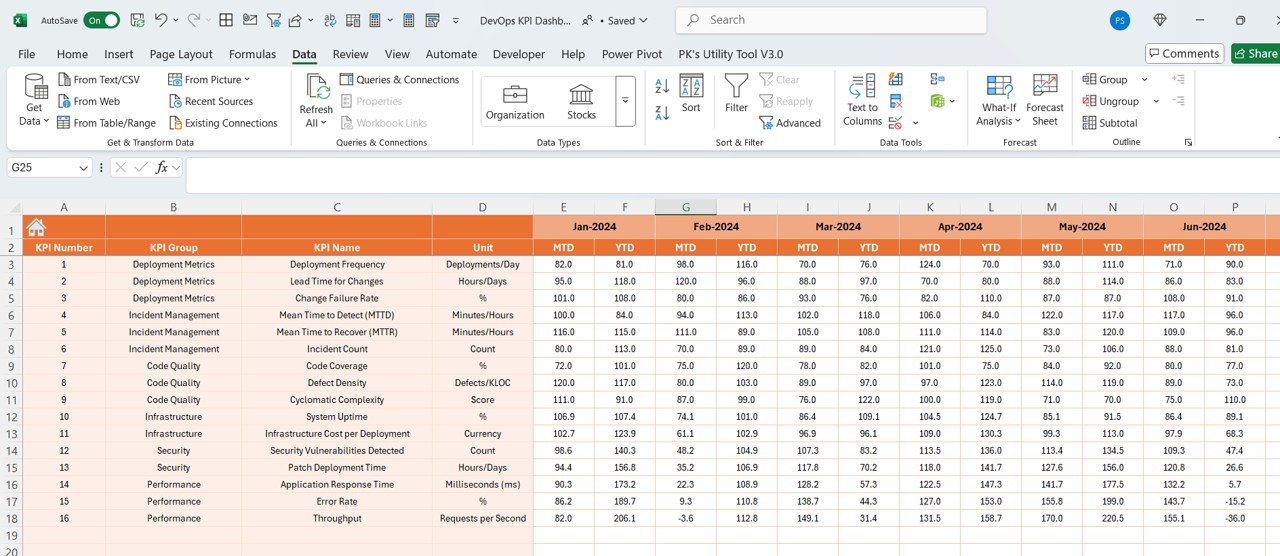
- Easily enter actual, target, and previous year numbers for accurate tracking.
Dynamic KPI Selection:
- Choose KPIs from a dropdown to analyze trends, formula definitions, and performance insights.
User-Friendly Navigation:
- Home sheet with quick-access buttons for seamless movement across different sheets.
Graphical Data Representation:
- Trend charts for monthly and yearly comparisons of KPI performance.
Customizable & Scalable:
- Adjust formulas, targets, and KPI definitions to match your business requirements.