An Exit Interview KPI Dashboard provides invaluable insights into the reasons why employees leave an organization, how to improve retention, and how to make informed decisions for future workforce strategies. This dashboard consolidates critical metrics and data from exit interviews to guide human resources (HR) and management in identifying trends, issues, and areas for improvement.
In this article, we will explore the key features of an Exit Interview KPI Dashboard, how it works, and how it can help improve employee retention and organizational health. We will also list essential KPIs, provide the unit of measurement, and explain whether the metric is better when lower or higher.
What is an Exit Interview KPI Dashboard?
An Exit Interview KPI Dashboard is a visual tool that HR professionals use to track key performance indicators (KPIs) related to employee turnover. It is typically powered by data collected during exit interviews and offers a comprehensive view of various employee metrics, including reasons for leaving, employee satisfaction, retention rates, and more. This helps organizations understand why employees are leaving and what can be done to reduce turnover.
Key Features of the Exit Interview KPI Dashboard
The Exit Interview KPI Dashboard template is a ready-to-use, fully integrated dashboard for analyzing employee turnover data. Below are the essential features of this KPI dashboard:
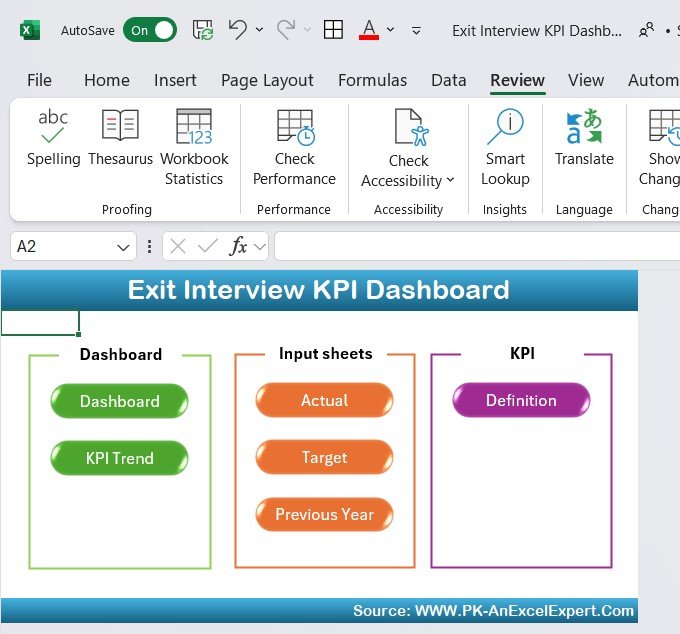
Home Sheet: The Index sheet that contains buttons to navigate to different sections of the dashboard, making it easy to use.
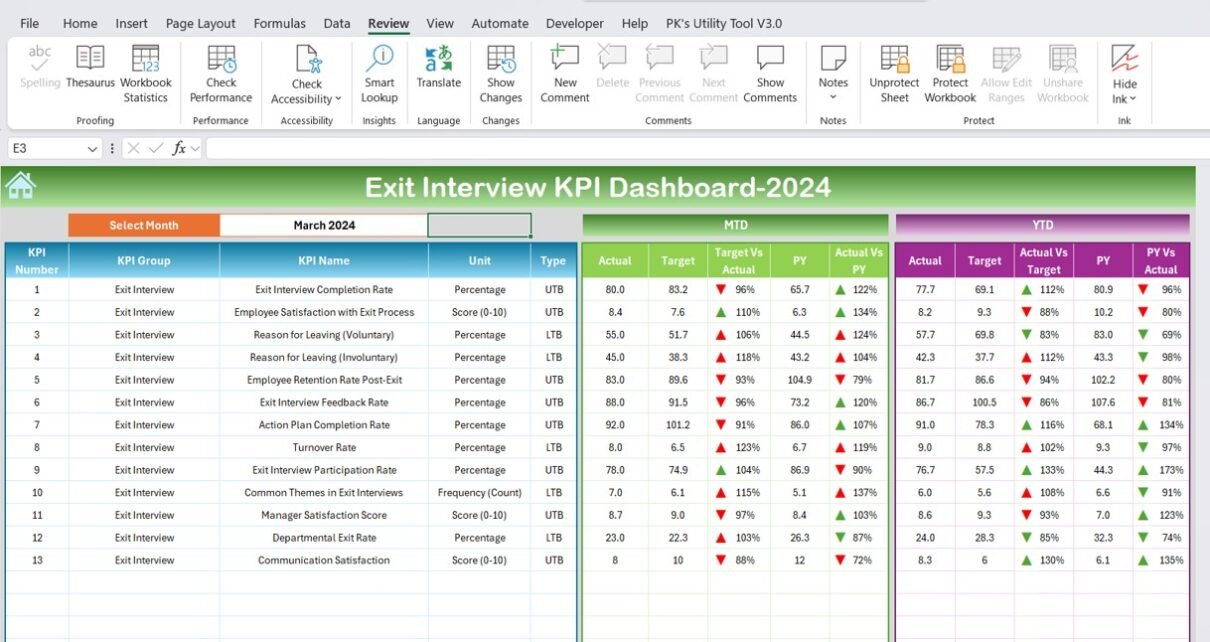
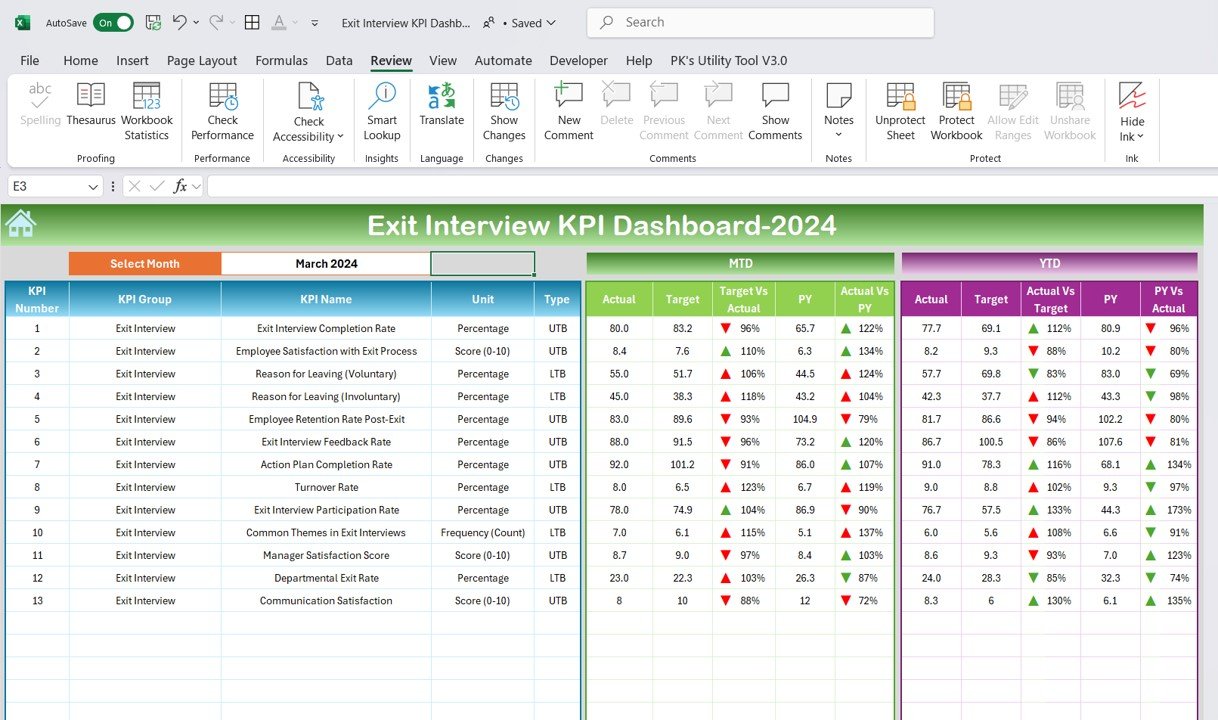
Dashboard Sheet Tab: The main dashboard that displays all KPI data for the selected month. It shows Month-to-Date (MTD) actual figures, targets, previous year data, and comparisons using conditional formatting (up/down arrows).
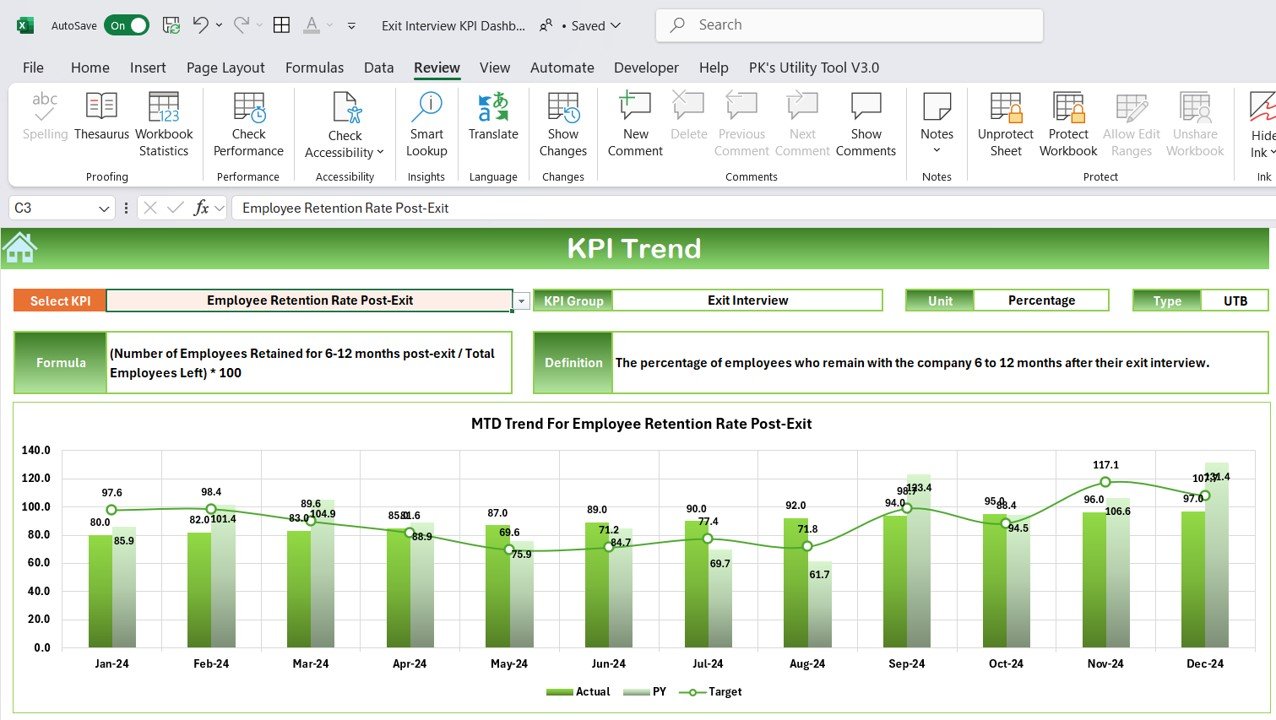
KPI Trend Sheet Tab: This tab allows users to select KPIs from a dropdown, view their group, unit, type, formula, and whether a lower or higher value is better.
Actual Number Sheet Tab: The sheet where you can input actual values for MTD and Year-to-Date (YTD) KPIs.

Target Sheet Tab: In this tab, you can enter the target figures for each KPI on a monthly and yearly basis.

Previous Year Number Sheet Tab: Enter previous year data here for comparison against current year figures.
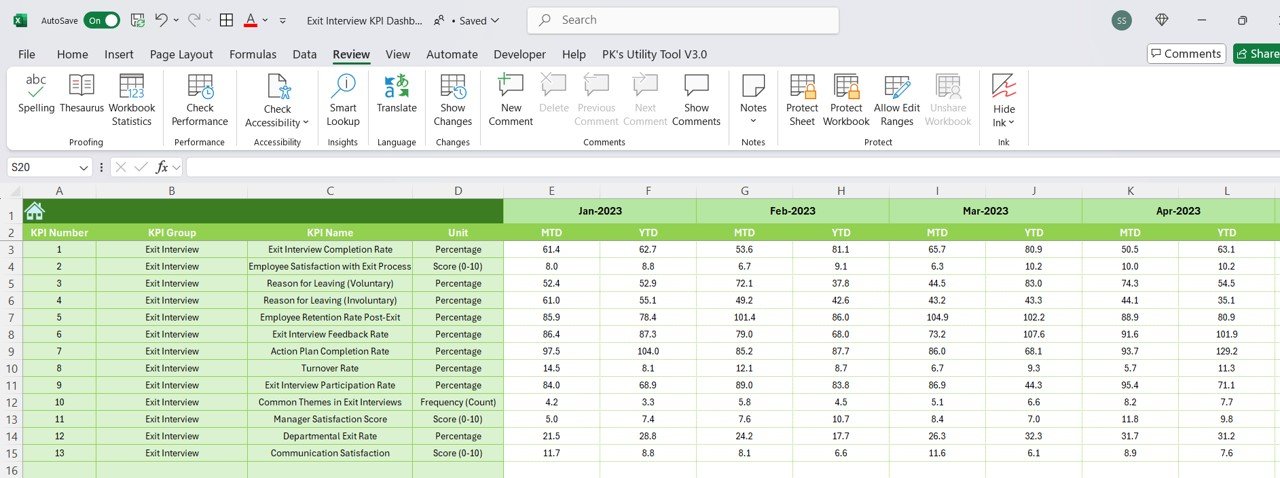
KPI Definition Sheet Tab: This sheet contains all the definitions for each KPI, including the formula and unit of measurement.

Advantages of Using an Exit Interview KPI Dashboard
Using an Exit Interview KPI Dashboard brings numerous advantages to an organization, from improving retention strategies to making data-driven decisions. Here are some key benefits:
- Data-Driven Insights: By tracking KPIs, companies gain valuable insights into employee behavior, allowing HR teams to proactively address issues before they escalate.
- Improved Retention: Understanding why employees leave helps companies implement targeted retention strategies that reduce turnover rates.
- Identify Organizational Weaknesses: Tracking exit satisfaction and reasons for leaving helps identify patterns, whether related to management, culture, or compensation, allowing for improvements in those areas.
- Benchmarking: The dashboard allows for comparison of current data with previous years or targets, helping organizations set realistic goals and expectations.
- Cost Savings: By understanding and addressing the reasons behind turnover, companies can lower the costs associated with hiring and training new employees.
Opportunity to Improve in the Exit Interview KPI Dashboard
While the Exit Interview KPI Dashboard is a powerful tool, there are always opportunities for improvement. Here are some ideas to enhance the effectiveness of this dashboard:
- Real-Time Data Integration: Incorporating real-time data from HR management systems (HRMS) can help ensure the dashboard always reflects the most up-to-date information.
- Incorporate Employee Feedback: Consider adding qualitative data from exit interviews (e.g., open-ended responses) to supplement the quantitative KPIs. This provides a more complete picture of employee sentiment.
- Advanced Analytics: Implement predictive analytics to identify employees who may be at risk of leaving in the near future, enabling HR teams to take preventative measures.
- Cross-Department Comparisons: Expand the dashboard to allow for comparisons across different departments or teams to pinpoint specific areas where turnover is higher.
Best Practices for Using the Exit Interview KPI Dashboard
To maximize the value of the Exit Interview KPI Dashboard, it’s essential to follow some best practices. Here are a few to keep in mind:
- Ensure Consistent Data Entry: Regularly update the dashboard with accurate MTD, YTD, and previous year data to maintain consistency in tracking.
- Customize KPIs: Tailor the dashboard to your organization’s unique needs by adding custom KPIs relevant to your industry or company culture.
- Set Actionable Targets: Use the dashboard to set clear, actionable targets for each KPI, and ensure that those targets are aligned with overall business goals.
- Monitor Trends Over Time: Regularly analyze KPI trends to track long-term changes and identify patterns that may require further attention.
- Collaborate with Key Stakeholders: Engage managers and department heads in reviewing the dashboard to get their feedback and ensure alignment with departmental goals.
Frequently Asked Questions (FAQs)
1. What is an Exit Interview KPI Dashboard?
An Exit Interview KPI Dashboard is a tool used to track key performance indicators related to employee turnover. It provides insights into why employees leave and how to improve retention strategies.
2. What KPIs should be included in an Exit Interview Dashboard?
Key KPIs for an Exit Interview Dashboard include Employee Turnover Rate, Retention Rate, Average Tenure, Exit Satisfaction Rate, and Cost of Turnover, among others.
3. How can I customize my Exit Interview KPI Dashboard?
You can customize the dashboard by adding organization-specific KPIs, adjusting targets, and incorporating data from different departments for detailed insights.
4. How can this dashboard help reduce employee turnover?
By identifying patterns and reasons for employee exits, the dashboard helps HR teams implement targeted retention strategies and improve organizational health.
5. Is it possible to integrate the Exit Interview KPI Dashboard with other HR systems?
Yes, the dashboard can be integrated with other HR systems, such as HRMS, to ensure real-time data synchronization and more accurate reporting.
Conclusion
An Exit Interview KPI Dashboard is a crucial tool for organizations looking to gain insights into their employee turnover. By tracking essential KPIs, companies can improve retention rates, reduce costs, and make data-driven decisions that benefit both employees and the organization. Following best practices, customizing the dashboard, and regularly updating the data will ensure that the dashboard provides valuable insights and helps create a better work environment for everyone.
Visit our YouTube channel to learn step-by-step video tutorials
View this post on Instagram