In the world of software development, tracking performance is essential for success. A Software Development KPI Dashboard helps monitor and evaluate the performance of your development team by providing clear insights into key metrics. By using KPIs (Key Performance Indicators), software development teams can ensure they’re staying on track with their goals, improving productivity, and delivering high-quality products. This article will guide you through the essential KPIs for your software development projects, how to use them effectively, and how to incorporate them into your dashboard.
Table of Contents
ToggleWhat is a Software Development KPI Dashboard?
A Software Development KPI Dashboard is a visual tool that provides an overview of key metrics used to track the progress and performance of a software development project. It aggregates data from different stages of the development process—such as coding, testing, deployment, and maintenance—and presents it in an easy-to-read format. By analyzing these KPIs, software development teams can identify areas for improvement, optimize processes, and ensure timely and quality delivery.
Key Features of the Software Development KPI Dashboard
The Software Development KPI Dashboard template provides a ready-to-use solution with all the necessary components to track and analyze software development metrics. Here are the key features of this dashboard:
Home Sheet:
This is the index sheet, which acts as the navigation hub of the dashboard. It contains six buttons that link directly to the respective sheets within the dashboard, making it easy to jump to any section.

Click to Software Development KPI
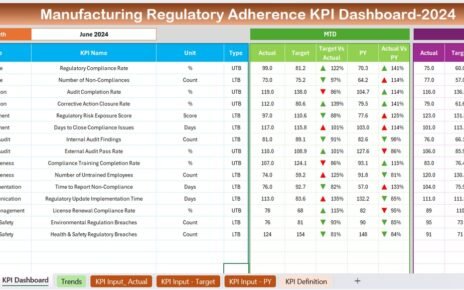
Dashboard Sheet Tab:
The main sheet where all KPIs are displayed. Users can select a specific month from the dropdown in cell D3, and the entire dashboard will update automatically to reflect the data for that month. It shows the Month-To-Date (MTD) and Year-To-Date (YTD) actual data, as well as target vs. actual comparisons and previous year (PY) vs. actual comparisons. Conditional formatting (up and down arrows) visually highlights the performance variations.

Click to Software Development KPI
KPI Trend Sheet Tab:
This sheet allows users to select a specific KPI from the dropdown in cell C3. It provides detailed information about each KPI, including the KPI group, unit of measurement, type (Lower the Better or Upper the Better), formula, and its definition. This sheet gives a deep dive into each KPI’s purpose and calculation method.

Click to Software Development KPI
Actual Numbers Sheet Tab:
Users input the actual numbers for MTD and YTD for each month. The sheet adjusts according to the month selected in cell E1, and users can input their actual values as they come in, providing real-time insights into performance.

Click to Software Development KPI
Target Sheet Tab:
This sheet is used to input the target values for each KPI for both MTD and YTD. These targets serve as benchmarks, which are then compared to the actual performance data to measure progress.

Click to Software Development KPI
Previous Year Numbers Sheet Tab:
Here, users can input the same data as in the actual numbers sheet, but for the previous year. This allows for year-over-year comparisons to track performance trends.

Click to Software Development KPI
KPI Definition Sheet Tab:
This tab provides a comprehensive definition for each KPI, including the KPI name, group, unit, formula, and its significance. This section helps ensure everyone understands the metrics being tracked and their impact on the project.

Click to Software Development KPI
Advantages of Using a Software Development KPI Dashboard
There are several key advantages to using a Software Development KPI Dashboard to track and measure the performance of your development team:
- Centralized Monitoring: All essential KPIs are in one place, making it easy to track and compare metrics across different stages of development.
- Data-Driven Decisions: With clear insights into performance, project managers can make informed decisions, identify bottlenecks, and optimize workflows.
- Real-Time Tracking: The dashboard offers real-time updates, allowing teams to monitor progress and make adjustments as needed without delays.
- Improved Communication: By visualizing KPIs, the dashboard fosters better communication between stakeholders, developers, and managers, ensuring alignment on goals.
- Quality and Speed: Tracking KPIs like Bug Rate, Code Churn, and Escaped Defects helps improve both the quality and speed of the development process.
Opportunities to Improve in Software Development KPI Tracking
While the Software Development KPI Dashboard provides valuable insights, there are always opportunities for improvement:
- Data Consistency: Ensure that data is consistently entered across the team to maintain the integrity of the dashboard’s insights.
- Integration with Development Tools: Consider integrating the dashboard with tools like JIRA, GitHub, or GitLab to automatically pull data and update metrics.
- Customization: Customize KPIs to reflect the unique goals of your development team or project. Tailoring metrics will help make the dashboard more relevant and actionable.
- Actionable Metrics: Focus on KPIs that directly impact decision-making. Remove any non-essential metrics that do not contribute to actionable insights.
Best Practices for Using a Software Development KPI Dashboard
To maximize the effectiveness of your Software Development KPI Dashboard, here are some best practices to follow:
- Set Clear Targets: Ensure that each KPI has a well-defined target. This helps teams know where they stand and what needs to be improved.
- Regularly Review KPIs: Regularly review the KPIs to ensure they are aligned with the overall business and project goals. Adjust targets as needed.
- Collaborate with Your Team: Use the dashboard to foster collaboration. Regular meetings focused on the KPIs help ensure that everyone is aligned and aware of performance.
- Track Trends Over Time: Look for patterns in the data to anticipate challenges and address issues before they become major roadblocks.
Conclusion
A Software Development KPI Dashboard is an invaluable tool for any development team looking to track performance, improve processes, and optimize their workflows. By focusing on key metrics like Cycle Time, Bug Rate, and Velocity, teams can identify areas for improvement and make data-driven decisions. With real-time insights and the ability to visualize key data points, software development teams can boost their productivity and deliver higher-quality software on time and within budget.
Frequently Asked Questions (FAQs)
1. What is the purpose of a Software Development KPI Dashboard?
A Software Development KPI Dashboard tracks key metrics to monitor team performance, optimize processes, and ensure timely delivery of software.
2. What KPIs should I track in my Software Development KPI Dashboard?
Essential KPIs include Cycle Time, Lead Time, Bug Rate, Velocity, Test Coverage, and Deployment Frequency.
3. How can I improve my development process using a KPI Dashboard?
The KPI Dashboard helps identify bottlenecks, monitor progress, and ensure teams are meeting their targets, leading to improved development processes.
4. Can I customize my Software Development KPI Dashboard?
Yes, the dashboard can be customized to reflect the unique needs and goals of your team or project.
5. How can I integrate the KPI Dashboard with other development tools?
Integrating with tools like JIRA or GitHub can automate data collection and keep your metrics up to date in real-time.
Visit our YouTube channel to learn step-by-step video tutorials