In today’s fast-paced world of digital marketing, understanding the performance of your campaigns is crucial to success. Performance marketing, with its focus on measurable results, allows businesses to track their return on investment (ROI) and ensure that every dollar spent drives meaningful outcomes. One of the best ways to keep track of these outcomes is by using a Performance Marketing KPI Dashboard in Power BI.
This article will guide you through the key features, benefits, and best practices of using a Performance Marketing KPI Dashboard integrated with Power BI, and how it can revolutionize how your team tracks, evaluates, and improves marketing performance.
Key Features of the Performance Marketing KPI Dashboard in Power BI
The Performance Marketing KPI Dashboard in Power BI template is comprehensive and easy to use. Below are the key features that make this dashboard an essential tool for tracking and improving your marketing performance:
1. Summary Page
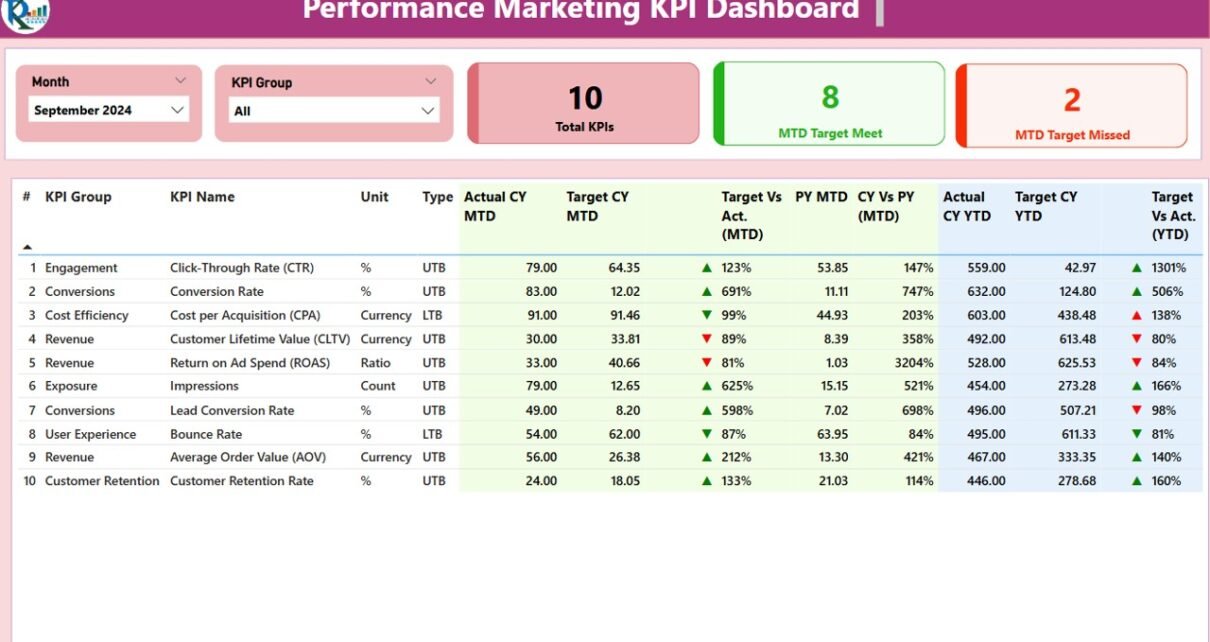
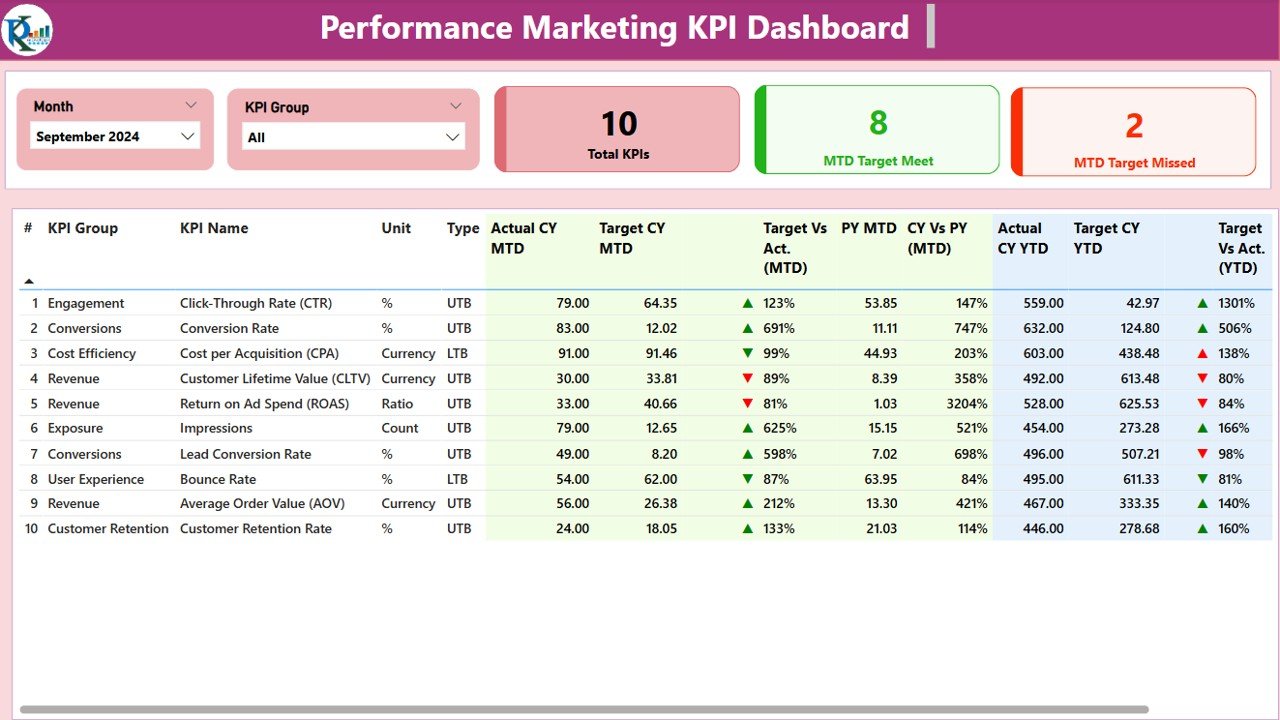
The Summary Page serves as the main page of the dashboard, providing an overview of your performance marketing KPIs. Here are the key elements of the summary page:
Month and KPI Group Slicer: These slicers allow you to filter data by month and by the group of KPIs you want to analyze. This feature adds flexibility to your analysis and enables you to focus on specific aspects of your campaigns.
KPIs Cards: Three cards display critical metrics:
- Total KPIs Count: The total number of KPIs being tracked in the dashboard.
- MTD Target Met Count: The number of KPIs where the Month-To-Date (MTD) target has been met.
- MTD Target Missed Count: The number of KPIs where the MTD target has been missed.
KPI Table: This table provides detailed information about each KPI, including:
- KPI Number: A unique sequential number for each KPI.
- KPI Group: The group or category to which the KPI belongs.
- KPI Name: The name of the performance marketing KPI.
- Unit: The unit of measurement for the KPI (e.g., percentage, dollar value).
- Type: Whether the KPI is “Lower the Better” (LTB) or “Upper the Better” (UTB).
- Actual CY MTD: The actual value for the current year’s MTD.
- Target CY MTD: The target value for the current year’s MTD.
- MTD Icon: Green and red arrows (▼ and ▲) indicate whether the KPI is meeting its MTD target.
- Target vs Actual (MTD): The percentage comparison between the actual MTD number and the target MTD number.
- PY MTD: The MTD number for the same period last year.
- CY vs PY (MTD): The percentage comparison between the current MTD and the previous year’s MTD.
- Actual CY YTD: The actual value for the current year’s Year-To-Date (YTD).
- Target CY YTD: The target value for the current year’s YTD.
- YTD Icon: Similar to MTD, showing whether the YTD target has been met (green) or missed (red).
- Target vs Actual (YTD): The percentage comparison between the actual YTD number and the target YTD number.
- PY YTD: The YTD number for the previous year.
- CY vs PY (YTD): The percentage comparison between the current year’s YTD and the previous year’s YTD.
2. KPI Trend Page
The KPI Trend Page offers an in-depth view of how your KPIs are performing over time. It includes:
- Combo Charts: Two combo charts that show actual numbers for the Current Year (CY), Previous Year (PY), and Targets for both MTD and YTD.
- KPI Slicer: On the left side, there’s a slicer that lets you select a specific KPI to analyze. This feature enables you to track the performance of individual metrics over time.
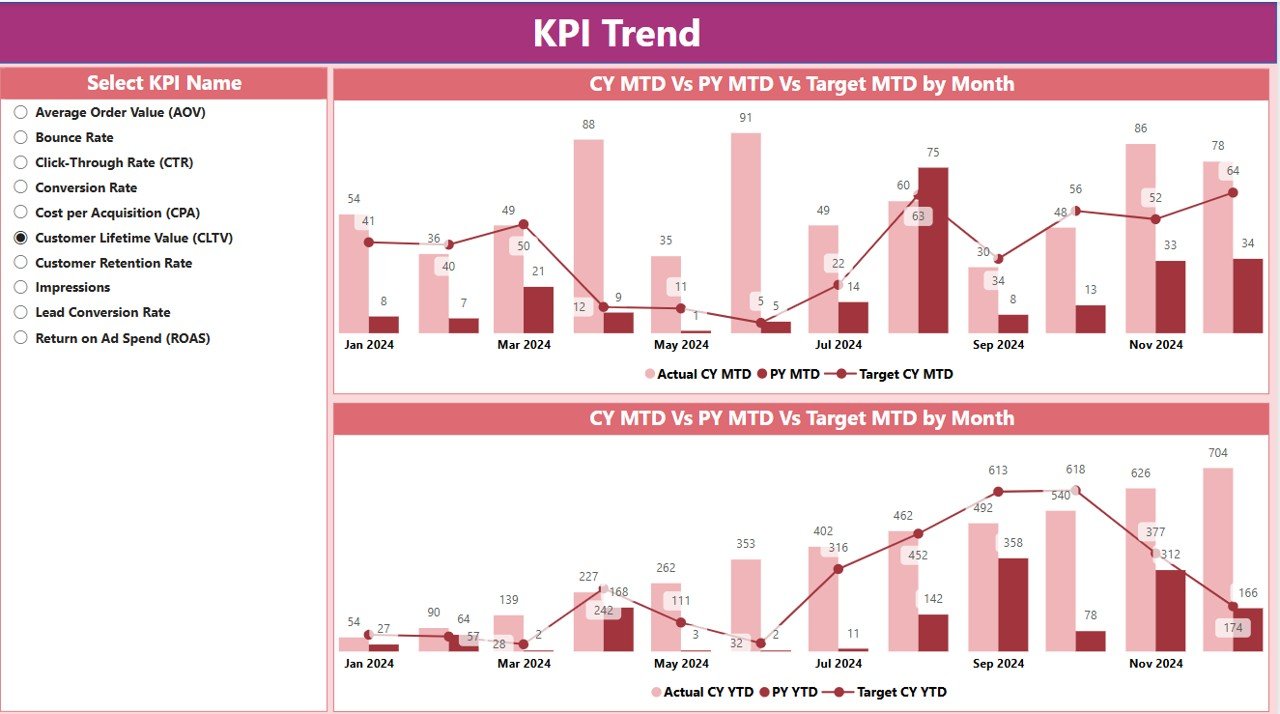
The KPI Trend Page provides valuable insights into trends and patterns in your marketing performance, helping you understand how various metrics evolve throughout the year.
3. KPI Definition Page
The KPI Definition Page serves as a drill-through page that provides detailed information about each KPI. This page is hidden by default but can be accessed by drilling down from the Summary Page. On this page, you’ll find:
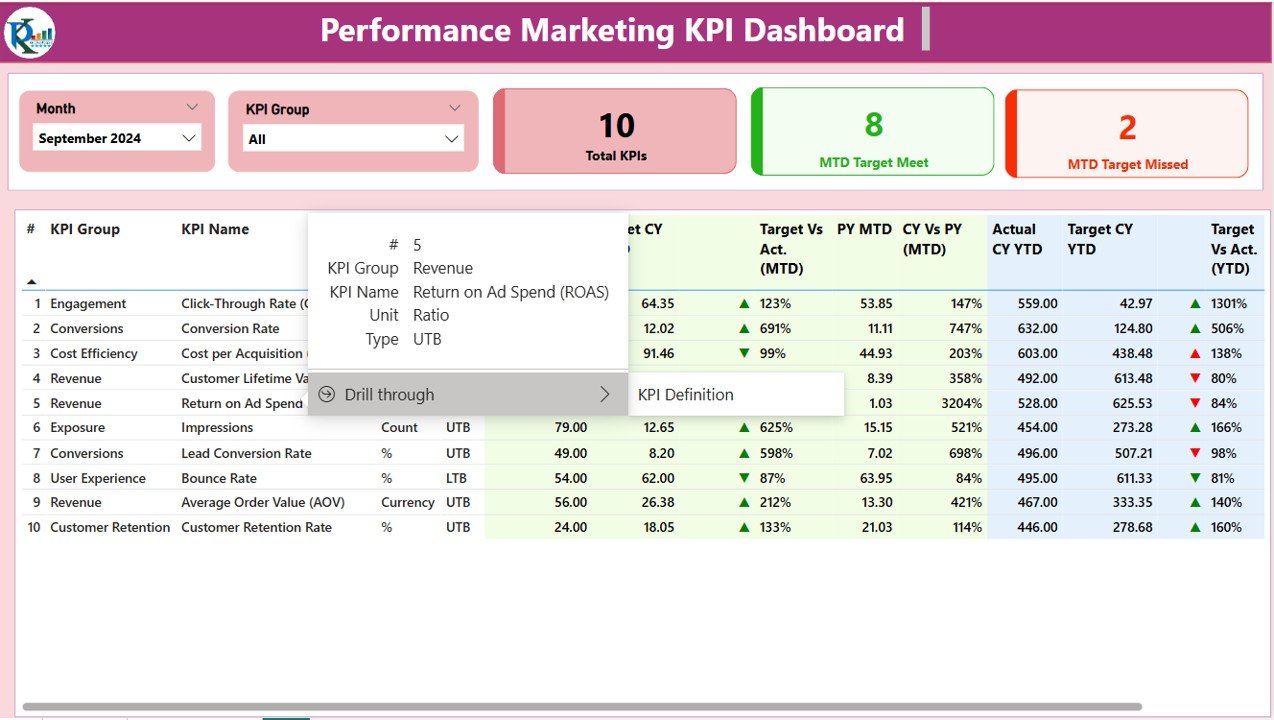
- KPI Formula and Definition: The formula used to calculate each KPI, along with a clear definition explaining what the KPI measures and why it’s important.
Back Button: A button located in the top left corner that lets you quickly return to the Summary Page.