The circular economy is a critical concept in today’s world, aiming to reduce waste and make the most of available resources. Tracking the effectiveness of various sustainability efforts through Key Performance Indicators (KPIs) plays a crucial role in advancing this model. With the Circular Economy KPI Dashboard in Power BI, businesses can effectively monitor and evaluate their performance in real-time, enabling informed decision-making and boosting sustainability efforts. In this article, we’ll explore how this Power BI dashboard works and how it helps organizations optimize their circular economy strategies.
What is the Circular Economy KPI Dashboard in Power BI?
The Circular Economy KPI Dashboard in Power BI is a powerful tool that helps businesses track and manage key sustainability metrics related to their circular economy goals. By using this dashboard, organizations can visualize data on key performance indicators, monitor progress towards targets, and identify areas for improvement.
Click to Circular Economy KPI
This dashboard integrates seamlessly with Excel, making it easy to manage data and ensure accurate reporting. It includes three main pages in the Power BI desktop application file, each providing valuable insights into different aspects of circular economy performance.
Key Features of the Circular Economy KPI Dashboard in Power BI
The Circular Economy KPI Dashboard in Power BI comes with several essential features designed to help you manage and track your sustainability efforts. Let’s take a closer look at the key features:
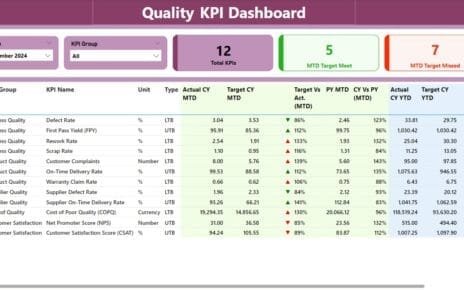
1. Summary Page
The Summary Page is the main hub of the dashboard, providing a high-level overview of your KPIs. It allows you to:
Filter by Month and KPI Group: Use slicers at the top to filter by month and KPI group.
Monitor KPI Performance: Track the total KPIs count, MTD (Month-to-Date) Target Met, and MTD Target Missed counts.
View Detailed KPI Information: See a detailed table that includes the following key columns:
- KPI Number: The unique identifier for each KPI.
- KPI Group: The category or group that the KPI belongs to.
- KPI Name: The name of the KPI being tracked.
- Unit: The unit of measurement for the KPI.
- Type (LTB or UTB): Whether the KPI is “Lower the Better” (LTB) or “Upper the Better” (UTB).
- Actual and Target Data: MTD and YTD (Year-to-Date) Actual numbers vs. Targets.
- Icons: Green (▲) or Red (▼) icons to show the performance against targets.
- Target vs Actual Percentage: Shows how closely the actual performance aligns with the target.
- Comparison to Previous Year (PY): Compare the current performance to the same period from the previous year.

Click to Circular Economy KPI
2. KPI Trend Page
The KPI Trend Page provides a more in-depth view of KPI performance over time. It includes:
- Combo Charts: Visualize the Actual Numbers for the Current Year (CY), Previous Year (PY), and Targets for both MTD and YTD.
- Slicer for KPI Selection: Select a specific KPI to view its performance trends.
This page helps track long-term trends, identify patterns, and assess whether your circular economy strategies are yielding results.

Click to Circular Economy KPI
3. KPI Definition Page
The KPI Definition Page offers a detailed breakdown of each KPI. This page is a drill-through feature, which means you can click on any KPI in the Summary Page to access this detailed view. It includes:

Click to Circular Economy KPI
- KPI Formula: Understand how each KPI is calculated.
- KPI Definition: Learn the significance and goal of each KPI.
- KPI Group and Type: Identify the group the KPI belongs to (e.g., resource efficiency, waste reduction) and whether it’s LTB or UTB.

Click to Circular Economy KPI
4. Excel Data Integration
The data source for the Circular Economy KPI Dashboard is an Excel file. You need to populate the following three sheets:
- Input_Actual Sheet Tab: Enter the actual KPI values for MTD and YTD.

Click to Circular Economy KPI
- Input_Target Sheet Tab: Enter the target values for MTD and YTD for each KPI.

Click to Circular Economy KPI
- KPI_Definition Sheet Tab: Define the KPIs, their units, formulas, and whether they are LTB or UTB.
This Excel integration allows for easy data management and keeps everything connected with the Power BI dashboard.

Click to Circular Economy KPI
Advantages of Using the Circular Economy KPI Dashboard in Power BI
Implementing the Circular Economy KPI Dashboard provides several benefits for businesses focusing on sustainability:
- Enhanced Sustainability Monitoring: Track sustainability efforts in real-time and ensure your circular economy strategies are on the right track. The dashboard helps monitor progress and highlights areas where targets are being missed.
- Clear and Visual Data Representation: The dashboard’s combo charts and data tables provide a clear visual representation of performance trends, making it easier for teams to interpret and act upon the data.
- Efficient Data Management: Seamlessly integrate Excel data with Power BI, reducing manual data entry and improving the accuracy and consistency of your KPI reporting.
- Real-Time Decision Making: The dashboard provides up-to-date performance metrics, empowering your team to make data-driven decisions that can lead to more effective circular economy practices.
Opportunity for Improvement in the Circular Economy KPI Dashboard
While the Circular Economy KPI Dashboard is a powerful tool, there are always opportunities for further improvement. Consider the following:
- Integration with Other Sustainability Platforms: Integrating the dashboard with other sustainability or project management tools can provide a more comprehensive view of your business’s overall environmental impact and help streamline reporting.
- Enhanced User Interface: Improving the dashboard’s user interface with more customization options (e.g., color themes, layout options) can improve the overall experience for users who need to interact with the dashboard regularly.
- Automation of Data Entry: Incorporating automation to pull data directly from other business tools (e.g., ERP systems, waste management software) would reduce the need for manual data entry and ensure more accurate and up-to-date information.
Best Practices for Using the Circular Economy KPI Dashboard in Power BI
To get the most out of your Circular Economy KPI Dashboard, follow these best practices:
- Regularly Update Your Data: Keep your data current by regularly updating your MTD and YTD values. This ensures the dashboard provides the most accurate insights.
- Set Clear Sustainability Goals: Before diving into the dashboard, set clear sustainability targets for each KPI. Knowing your desired outcomes will help you interpret the data effectively and take actionable steps.
- Customize KPI Targets: Adjust the targets for each KPI based on your business’s specific circular economy objectives. Customize the dashboard to match your company’s unique needs and goals.
- Involve Key Stakeholders: Involve team members from various departments in interpreting and acting upon the data. This helps drive collaboration and ensures that everyone is aligned on sustainability efforts.
Conclusion
The Circular Economy KPI Dashboard in Power BI is an invaluable tool for businesses striving to enhance their sustainability efforts. By offering real-time performance tracking, clear data visualizations, and seamless Excel integration, this dashboard helps organizations effectively monitor their circular economy KPIs. With continuous monitoring, optimization, and customization, businesses can use this dashboard to make better decisions, improve their sustainability practices, and ultimately contribute to a more sustainable future.
Frequently Asked Questions (FAQs)
1. What is the Circular Economy KPI Dashboard in Power BI?
The Circular Economy KPI Dashboard in Power BI is a data visualization tool that helps businesses track and monitor their circular economy KPIs in real-time. It integrates with Excel to provide detailed insights into sustainability performance.
2. How does the Circular Economy KPI Dashboard help businesses?
The dashboard allows businesses to track key sustainability metrics, compare actual performance with targets, and identify areas for improvement, making it easier to optimize circular economy practices.
3. Can I customize the KPIs in the dashboard?
Yes, you can customize the KPIs, targets, and formulas in the dashboard to fit your business’s unique circular economy goals.
4. How often should I update the Circular Economy KPI Dashboard?
Regularly update the dashboard with the latest MTD (Month-to-Date) and YTD (Year-to-Date) data to ensure that the information is always accurate and up to date.
5. Is the dashboard suitable for small businesses?
Yes, the dashboard can be customized to suit businesses of all sizes. The ability to track and analyze sustainability performance is beneficial for any organization committed to a circular economy model.
Visit our YouTube channel to learn step-by-step video tutorials
View this post on Instagram