
Freelancers need an efficient way to track their performance, income, and business growth. This is where a Freelance Business KPI Dashboard in Power BI becomes invaluable. It allows freelancers to measure their Key Performance Indicators (KPIs) effectively, track progress, and make data-driven decisions.
This guide will walk you through the features, benefits, best practices, and implementation of a Freelance Business KPI Dashboard in Power BI. We will also cover frequently asked questions at the end to clear any doubts.
Click to Freelance Business KPI
What is a Freelance Business KPI Dashboard?
A Freelance Business KPI Dashboard is a data visualization tool designed to help freelancers monitor their performance in real-time. It aggregates key metrics such as income, expenses, client acquisition, project completion rates, and time efficiency into an easy-to-read dashboard.
With Power BI, freelancers can analyze trends, compare past and present performance, and set goals for continuous improvement.
Key Features of the Freelance Business KPI Dashboard in Power BI
This Freelance Business KPI Dashboard consists of three pages within the Power BI Desktop application:
Summary Page
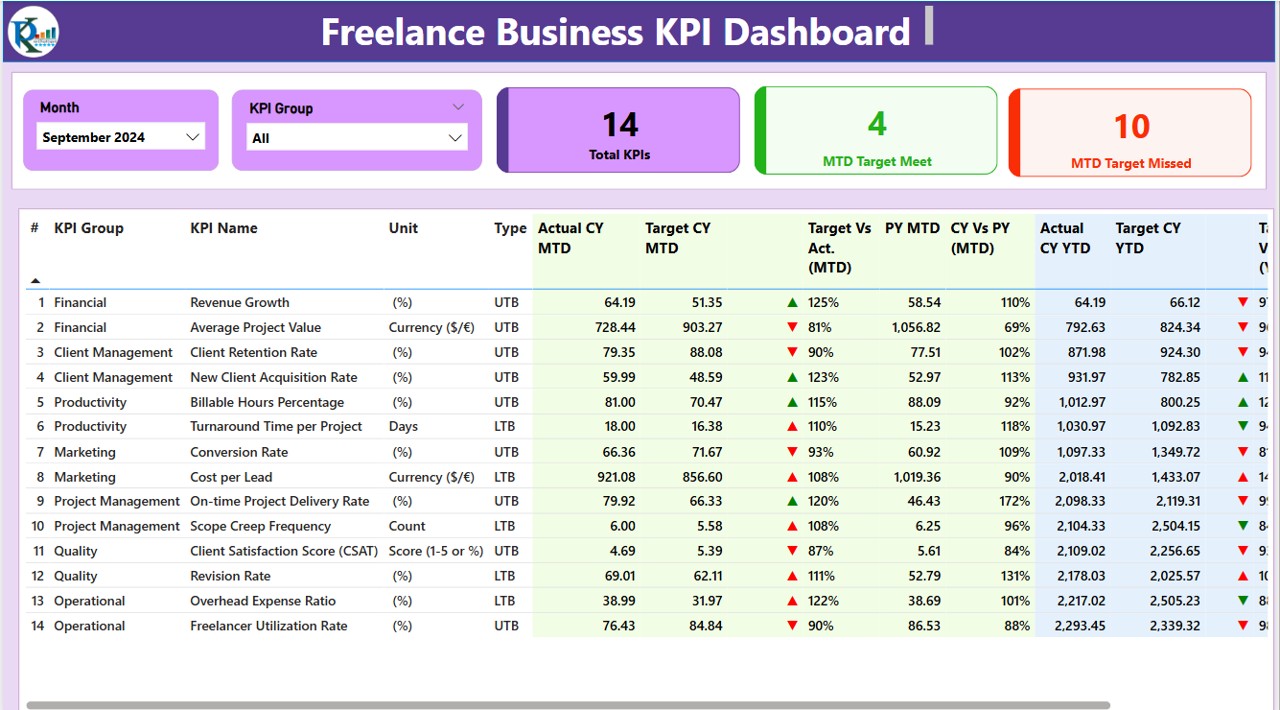
The Summary Page provides an overview of all KPIs, including:
- Month and KPI Group Slicer – Allows filtering by month and KPI category.
- KPI Count Cards – Displays total KPIs, MTD (Month-to-Date) target met, and MTD target missed.
- Detailed KPI Table – Contains essential KPI data:
- KPI Number – Unique identifier.
- KPI Group – The category of KPI.
- KPI Name – Name of the KPI.
- Unit – Measurement unit (e.g., hours, dollars, percentage).
- Type – LTB (Lower the Better) or UTB (Upper the Better).
- Actual CY MTD – Current Year Month-to-Date actual values.
- Target CY MTD – Target values for the same period.
- MTD Icon – Indicators (green ▲ for on-track, red ▼ for below target).
- Target vs. Actual (MTD) – Percentage comparison.
- PY MTD – Previous Year Month-to-Date numbers.
- CY vs. PY (MTD) – Year-over-year MTD comparison.
- Actual CY YTD – Current Year Year-to-Date actual values.
- Target CY YTD – Year-to-Date target values.
- YTD Icon – Similar to MTD icons, indicating performance.
- Target vs. Actual (YTD) – Percentage comparison.
- PY YTD – Last year’s YTD numbers.
- CY vs. PY (YTD) – Year-over-year YTD comparison.
Click to Freelance Business KPI
KPI Trend Page
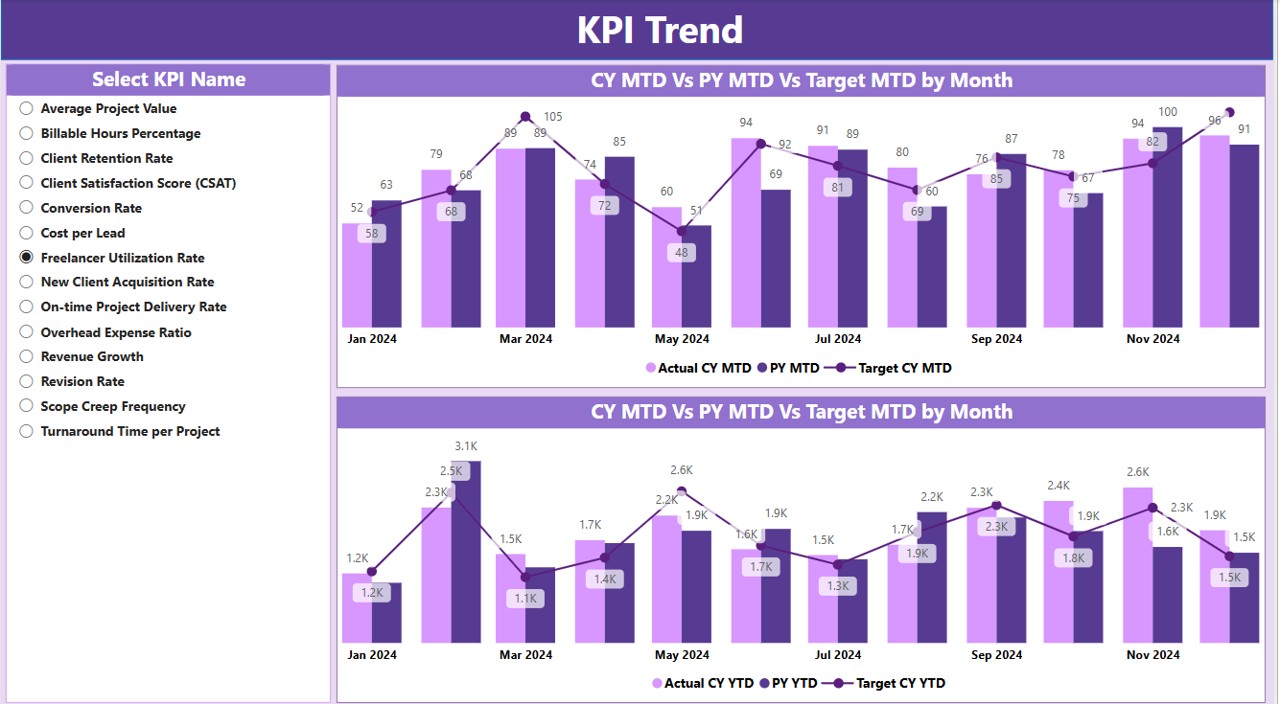
This section provides a visual representation of performance trends over time. It includes:
- Two Combo Charts – Displaying Current Year, Previous Year, and Target values for both MTD and YTD.
- KPI Name Slicer – Allows selection of specific KPIs for a detailed view.
KPI Definition Page
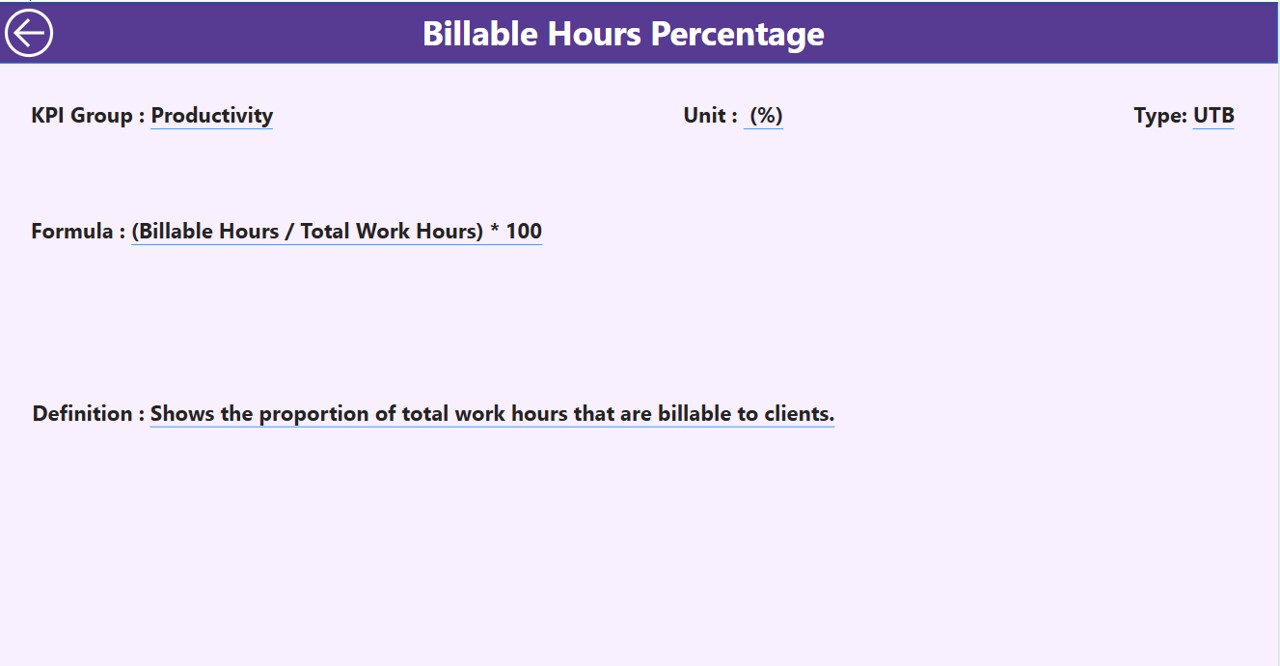
This is a hidden drill-through page accessible via the Summary Page. It contains:
- KPI Name – The full name of the KPI.
- Formula – The mathematical formula used.
- Definition – Explanation of what the KPI represents.
A Back Button on the top-left corner allows users to navigate back to the Summary Page.
How the Dashboard Uses Excel Data
This Power BI dashboard sources its data from an Excel file with three worksheets:
Click to Freelance Business KPI
Input Actual Sheet
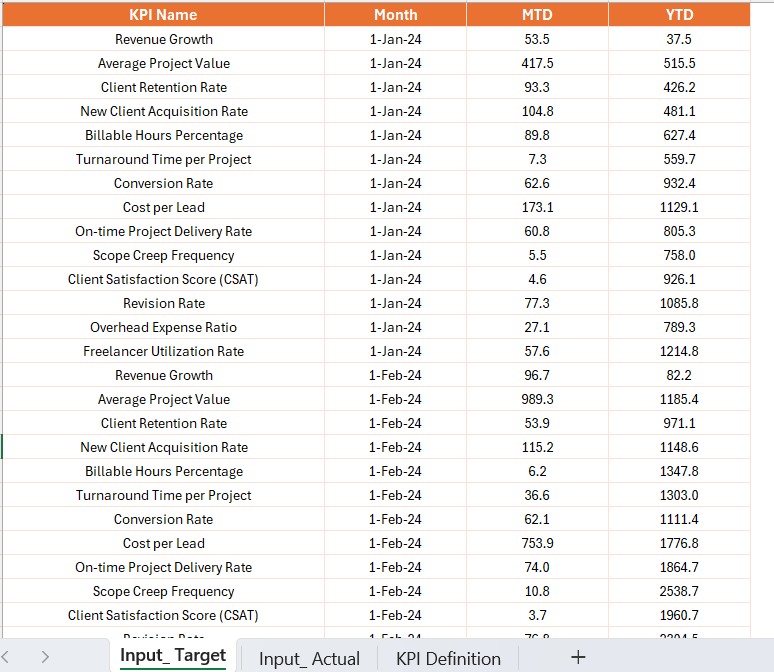
- Enter actual KPI numbers, month, MTD, and YTD figures.
Input Target Sheet
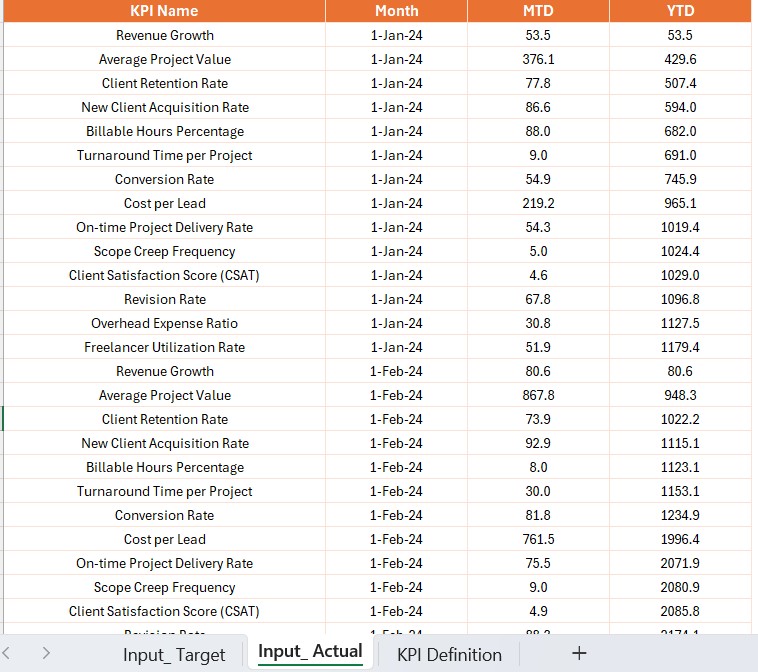
- Enter target KPI numbers for each period.
KPI Definition Sheet
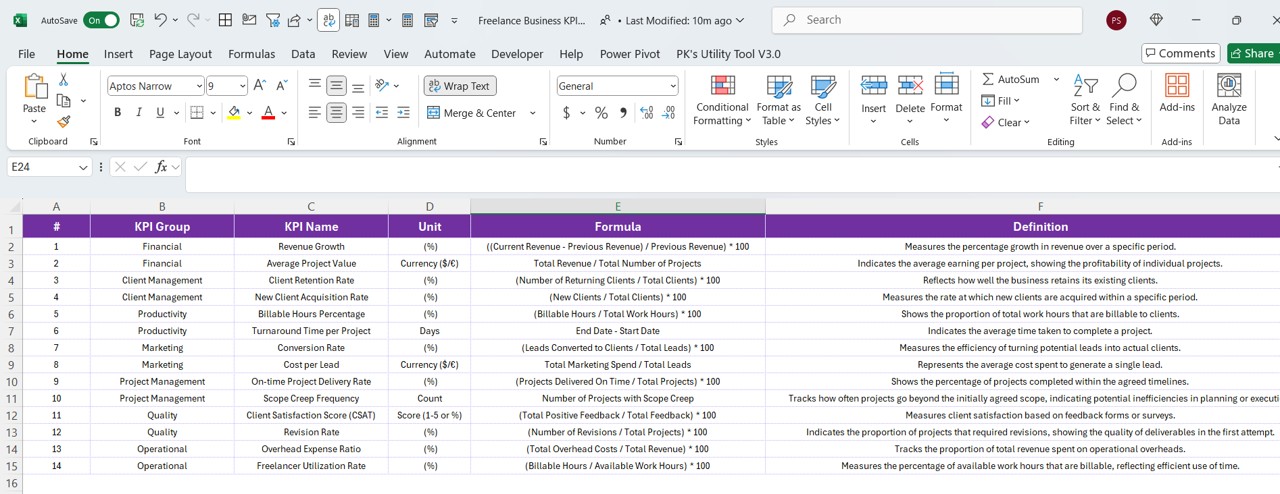
- Define KPI number, name, unit, formula, type (LTB/UTB), and description.
Advantages of Using a Freelance KPI Dashboard in Power BI
- Improved Decision Making – Helps freelancers make data-driven decisions.
- Performance Monitoring – Tracks financial and productivity KPIs efficiently.
- Customizable Metrics – Adjust the dashboard based on freelance business needs.
- Historical Comparison – Compares current and past performance.
- Visual Representation – Uses interactive charts and tables for better insights.
Click to Freelance Business KPI
Best Practices for Using the Freelance Business KPI Dashboard
- Keep Data Updated – Regularly update the input sheets for accurate reporting.
- Use Filters Wisely – Utilize the slicers to analyze specific timeframes and KPI groups.
- Monitor Trends – Pay close attention to MTD vs. YTD and CY vs. PY metrics.
- Optimize KPI Selection – Focus on KPIs that truly impact business growth.
- Drill Down for Details – Use the KPI Definition Page for deeper insights into metrics.
Conclusion
A Freelance Business KPI Dashboard in Power BI is a powerful tool for freelancers looking to enhance their performance tracking. With well-structured pages, real-time insights, and historical comparisons, it provides a clear picture of business success. By implementing best practices, freelancers can streamline their workflow, make better business decisions, and grow their freelancing career effectively.
Frequently Asked Questions (FAQs)
How does this KPI Dashboard help freelancers?
This dashboard allows freelancers to monitor key performance indicators, including income, client retention, and project completion rates, in real-time.
Can I customize the KPIs in this dashboard?
Yes, the dashboard is fully customizable. You can add new KPIs, modify existing ones, and update targets based on business requirements.
How often should I update the data in my dashboard?
It is recommended to update the actual and target KPI values at least once a month for accurate performance tracking.
Do I need advanced Power BI skills to use this dashboard?
No, basic Power BI knowledge is sufficient. The dashboard is designed to be user-friendly, with slicers and drill-through features making navigation easy.
Can I connect this dashboard to a live data source?
Yes, you can integrate it with live data sources such as Google Sheets, SQL databases, or cloud services to automate updates.
What are the key metrics every freelancer should track?
Freelancers should focus on income trends, project completion rate, client acquisition cost, hourly rate, and customer satisfaction score.
Click to Freelance Business KPI
Visit our YouTube channel to learn step-by-step video tutorials
View this post on Instagram


