Investor relations (IR) play a crucial role in maintaining transparency and building trust with stakeholders. A well-structured Investor Relations KPI Dashboard in Excel helps track key financial metrics, measure performance, and provide insights for better decision-making. This article will guide you through the importance of Investor Relations KPIs, best practices, and how to use the Investor Relations KPI Dashboard in Excel efficiently.
Click to Investor Relations KPI
What is an Investor Relations KPI Dashboard?
An Investor Relations KPI Dashboard is a structured template designed to monitor, analyze, and present key financial and operational metrics relevant to investor relations. It consolidates crucial data points into an easy-to-understand format, helping executives, financial analysts, and investors make data-driven decisions.
Why Use an Investor Relations KPI Dashboard?
- Tracks Key Metrics: Helps monitor the financial health of an organization.
- Enhances Transparency: Provides clear and accurate information to investors.
- Improves Decision-Making: Facilitates better strategic planning.
- Saves Time: Automates KPI calculations, reducing manual effort.
Click to Investor Relations KPI
Key Features of the Investor Relations KPI Dashboard in Excel
This ready-to-use template is designed to simplify investor relations management. Below are the key features of this KPI Dashboard:
Home Sheet
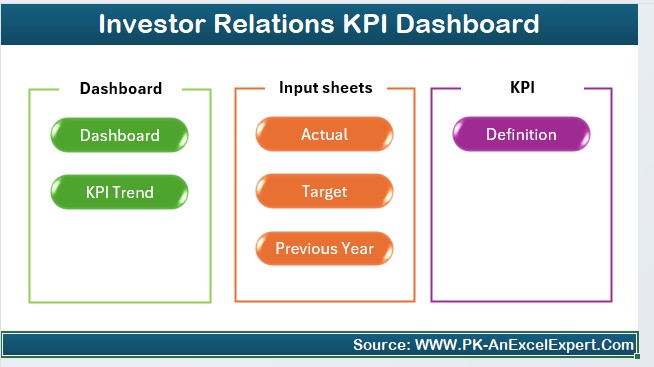
The Home Sheet serves as an index page, providing 6 buttons to navigate to different sections of the dashboard. This improves user experience and makes navigation seamless.
Dashboard Sheet Tab
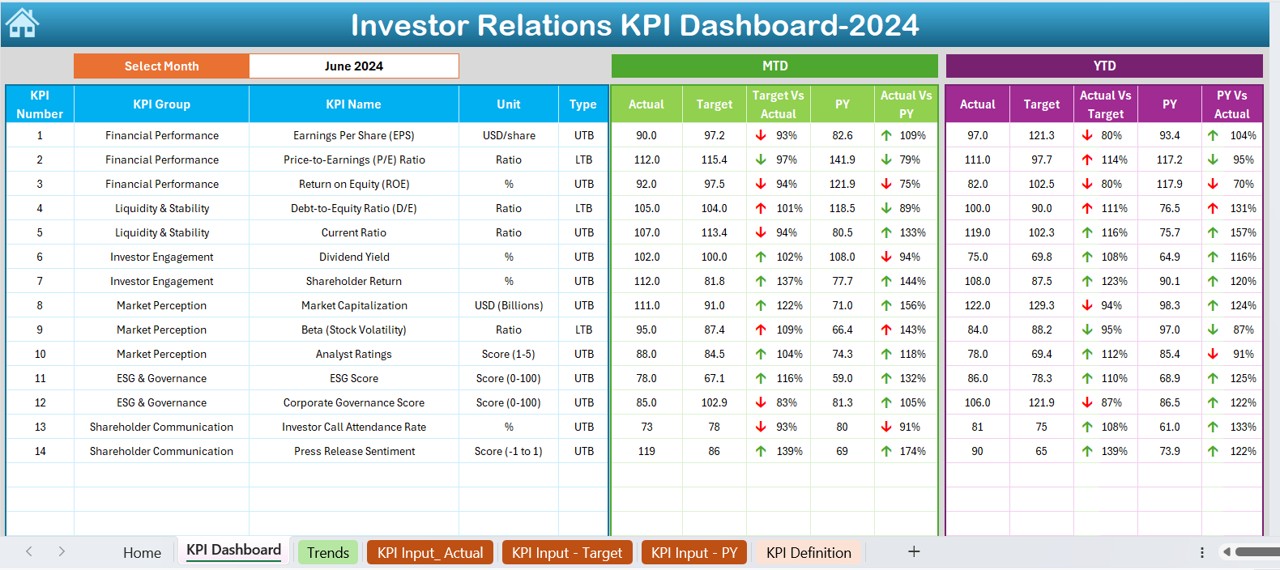
This is the core sheet where all the investor-related KPIs are displayed. Here’s what you’ll find:
- Month Selection: Select a month from the drop-down (cell D3) to view KPIs for that period.
- Key Metrics Display: MTD (Month-to-Date) Actual, Target, and Previous Year (PY) numbers.
- YTD (Year-to-Date) Comparisons: Displays Actual, Target, and PY values.
- Conditional Formatting: Uses up/down arrows to indicate performance trends.
KPI Trend Sheet Tab
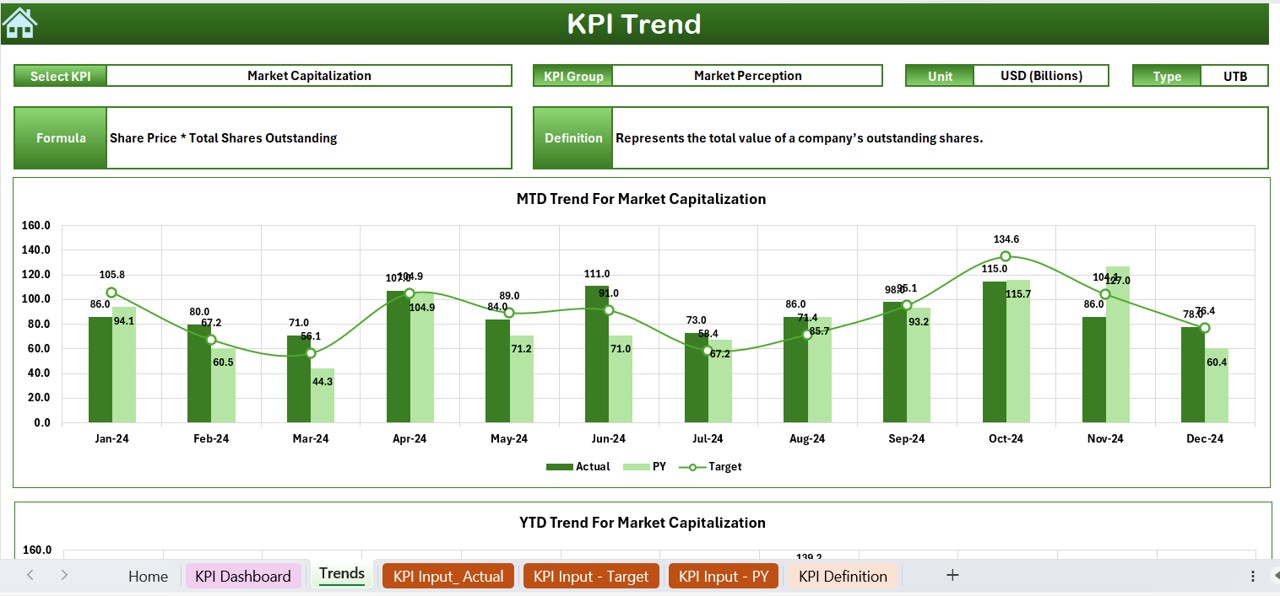
This tab allows users to track KPI trends over time. Features include:
- KPI Name Selection (C3 Drop-down): Choose a KPI to analyze.
- Detailed KPI Information: Includes KPI Group, Unit, Type (Lower/Upper Better), and Formula.
- Trend Charts: MTD and YTD trend charts for Actual, Target, and PY values.
Click to Investor Relations KPI
Actual Numbers Input Sheet
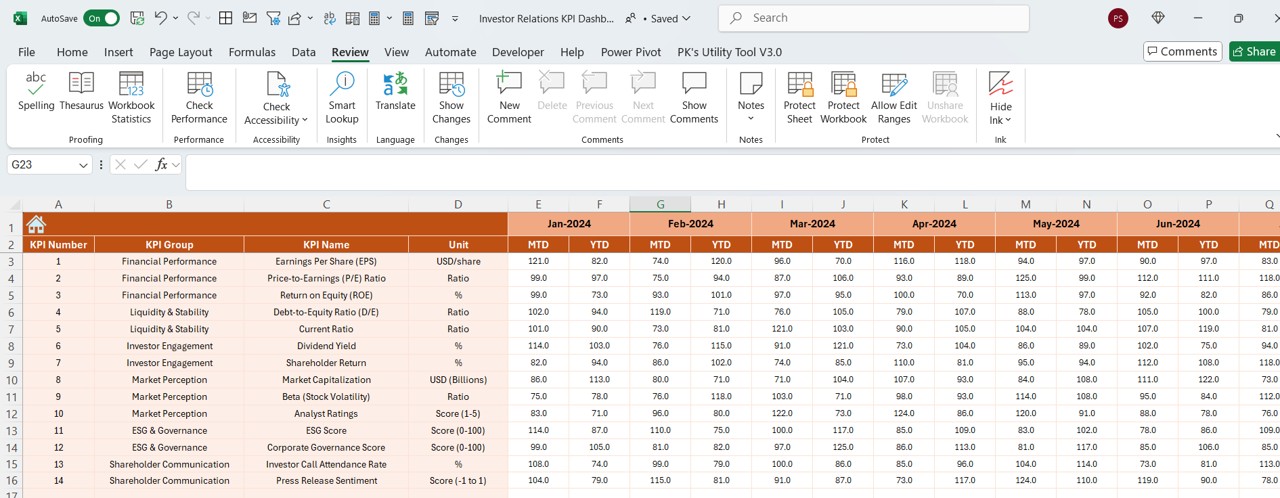
This sheet is used to input actual performance data for each KPI:
- Month Selection (E1): Define the first month of the financial year.
- Enter Actual Values: Populate MTD and YTD data manually.
Target Sheet Tab
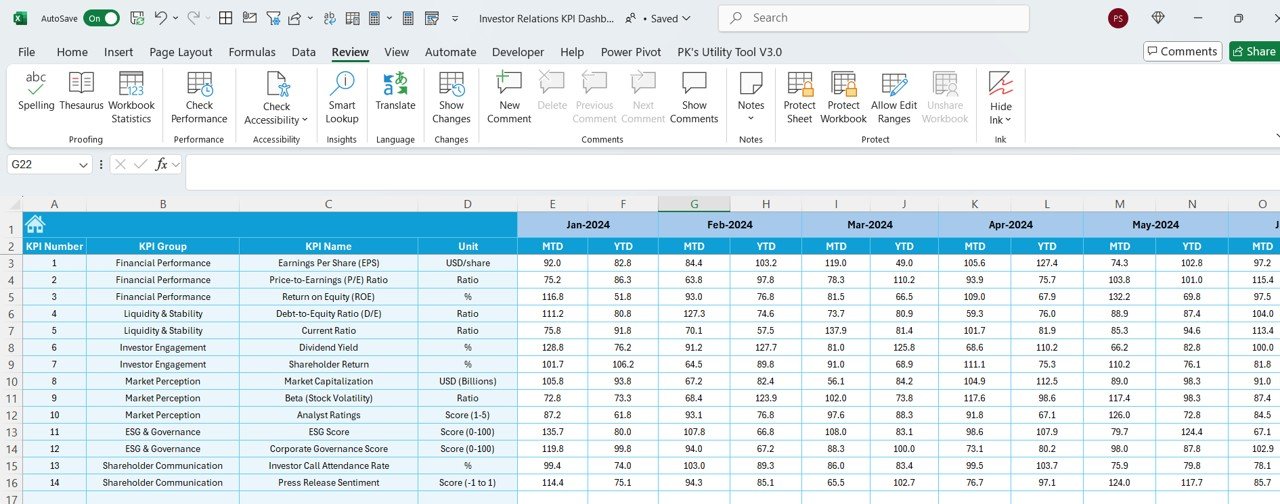
This sheet allows target setting for each KPI:
- MTD and YTD Targets: Set expected values for each metric.
- Comparison with Actuals: Helps measure performance gaps.
Previous Year Number Sheet
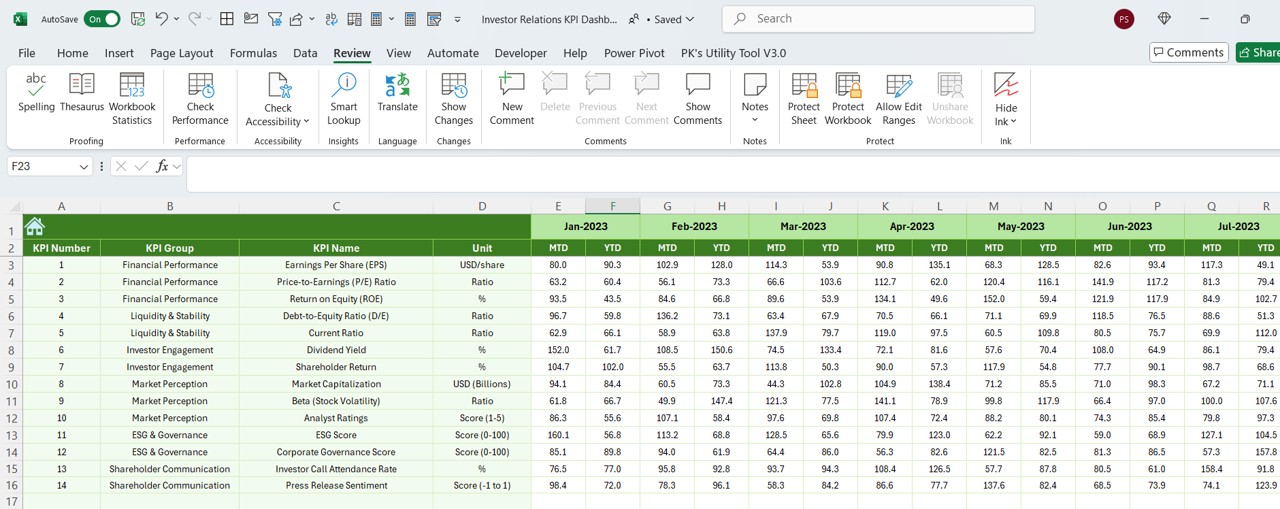
- Historical Data Entry: Enter previous year’s data for better comparisons.
- PY vs. Actual Analysis: Understand growth patterns and trends.
KPI Definition Sheet Tab
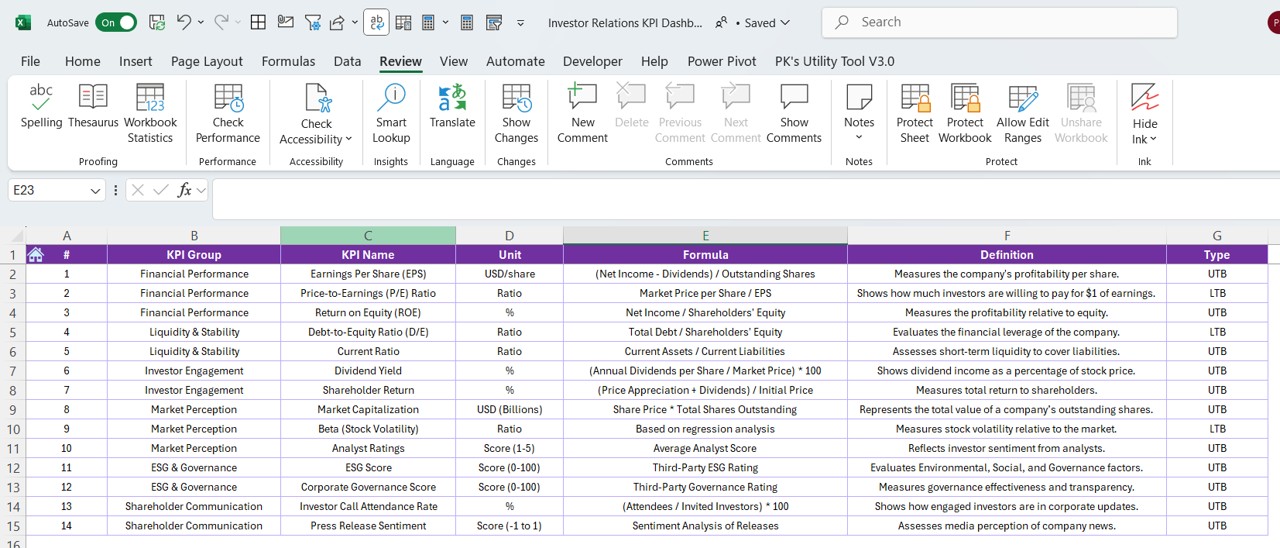
- KPI Descriptions: Define each KPI’s purpose.
- KPI Metrics: Includes KPI Name, Group, Unit, Formula, and Definition.
Advantages of Using an Investor Relations KPI Dashboard in Excel
Better Financial Insights
An IR KPI Dashboard helps investors and management analyze financial performance efficiently, leading to more informed decisions.
Automated Tracking & Reporting
With Excel formulas and automation, this dashboard eliminates manual calculations and speeds up reporting.
Real-Time Performance Monitoring
Investors can track real-time financial trends, making it easier to assess risk and opportunities.
Data-Driven Decision Making
By providing accurate KPI comparisons, this dashboard allows for fact-based strategic planning.
Best Practices for Using the Investor Relations KPI Dashboard
🔹 Keep Data Up-to-Date: Ensure that all input sheets (Actual, Target, and PY Numbers) are regularly updated.
🔹 Use Consistent Formats: Maintain consistent number formatting (e.g., currency, percentages) to enhance readability.
🔹 Monitor KPI Trends: Regularly review the KPI Trend Sheet to spot performance fluctuations.
🔹 Set Realistic Targets: Define achievable goals to accurately measure business success.
🔹 Leverage Conditional Formatting: Use visual indicators like arrows and color coding to highlight key trends.
Conclusion
Click to Investor Relations KPI
An Investor Relations KPI Dashboard in Excel is an essential tool for any organization looking to streamline investor communication and financial performance tracking. By effectively using this pre-built template, businesses can ensure transparency, improve financial planning, and make data-driven investment decisions.
Frequently Asked Questions (FAQs)
What are Investor Relations KPIs?
Investor Relations KPIs are key financial and performance indicators that help track a company’s financial health and investor engagement.
How do I update data in the IR KPI Dashboard?
Simply enter actual numbers in the Actual Numbers Input sheet, update targets in the Target Sheet, and add previous year’s data for comparison.
Can I customize this dashboard for my company?
Yes! The Investor Relations KPI Dashboard is fully customizable—you can add new KPIs, modify formulas, and change design elements.
How often should I update this dashboard?
For accurate tracking, update the MTD data monthly and the YTD data quarterly.
What software do I need to use this dashboard?
This Excel-based dashboard works best in Microsoft Excel (2016 or later) or Excel for Office 365.
How does this dashboard help investors?
Investors use this dashboard to assess company performance, compare trends, and make informed investment decisions.
Can I integrate this dashboard with Power BI?
Yes, you can import Excel data into Power BI for advanced visualizations and analytics.
Click to Investor Relations KPI
Visit our YouTube channel to learn step-by-step video tutorials
View this post on Instagram