Startups need clear insights into their growth metrics to make data-driven decisions. A Startup Growth KPI Dashboard in Power BI helps businesses track their performance by analyzing key metrics like monthly and yearly targets, actual numbers, and trends.
This article explains the Startup Growth KPI Dashboard, its key features, benefits, and best practices for implementation in Power BI.
Click to Startup Growth KPI
What is a Startup Growth KPI Dashboard?
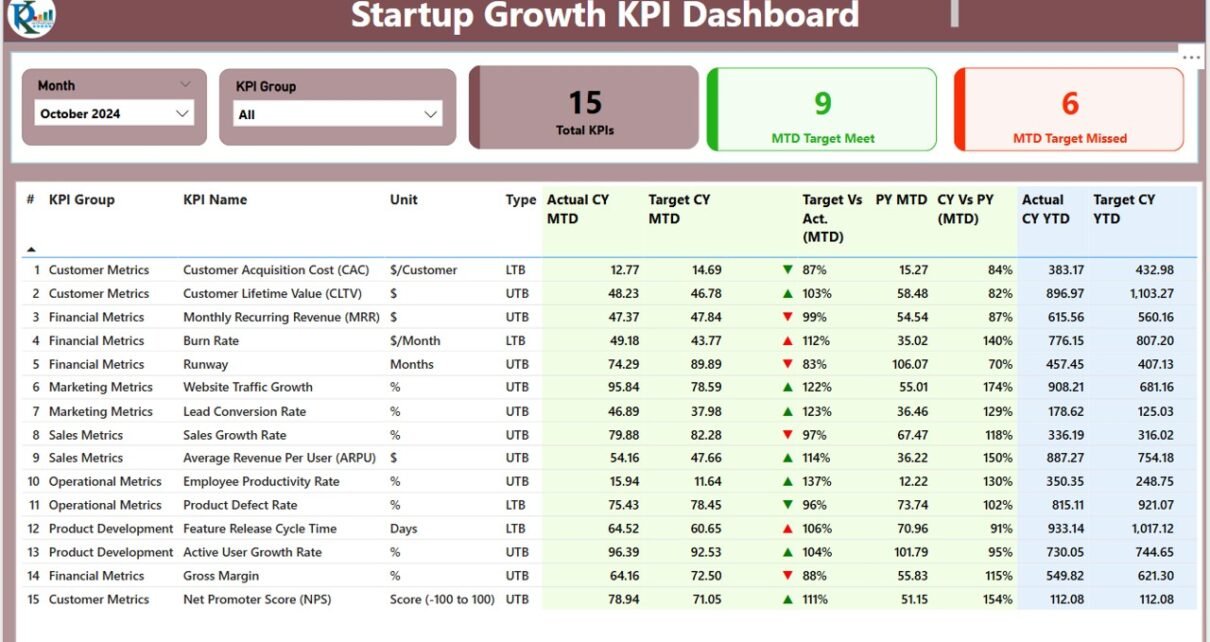
A Startup Growth KPI Dashboard is a visual representation of essential business metrics in Power BI. It allows startups to monitor their progress in real-time, compare historical data, and set data-driven objectives.
- This dashboard provides insights into:
- Monthly and Yearly Targets vs. Actuals
- Trend Analysis
- Performance Indicators for Growth
- KPI Group Classification
- Data-driven Decision Making
Key Features of the Startup Growth KPI Dashboard
The Startup Growth KPI Dashboard is built using Power BI Desktop and consists of three key pages:
Summary Page
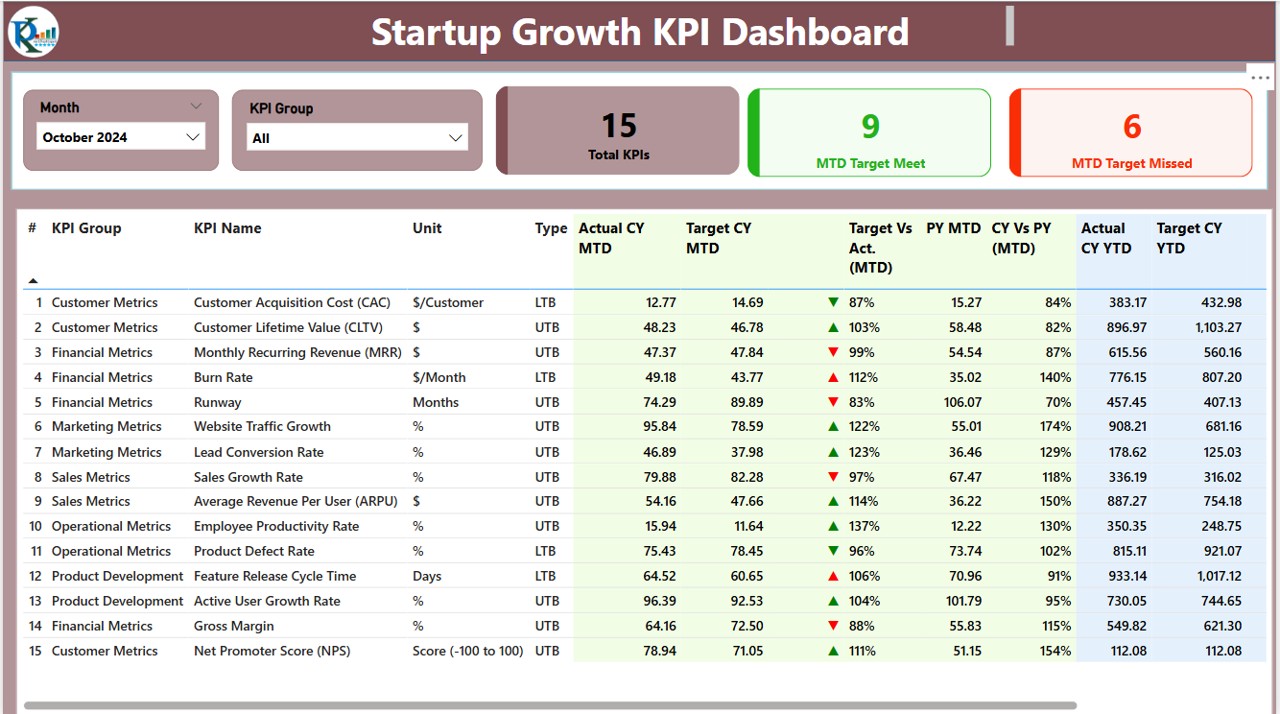
- This is the main page of the dashboard where users get an overview of startup performance. Key components include:
- Month and KPI Group Slicer: Allows users to filter KPIs based on month and category.
Click to Startup Growth KPI
KPI Cards: Displays key metrics such as:
- Total KPI Count
- MTD Target Met Count
- MTD Target Missed Count
Detailed KPI Table
- KPI Number: Sequence number for easy identification.
- KPI Group: Category grouping of KPIs.
- KPI Name: Specific KPI tracked.
- Unit: Measurement unit (e.g., percentage, dollars, count).
- Type: Indicator of whether a KPI is Lower the Better (LTB) or Upper the Better (UTB).
- Actual CY MTD & Target CY MTD: Current Year Month-to-Date actual vs. target.
- MTD Status Icon: Uses ▲ (green) and ▼ (red) to indicate KPI status.
- Target vs. Actual (MTD): Percentage difference between actual and target values.
- PY MTD: Previous Year’s Month-to-Date performance.
- CY vs. PY (MTD): Comparison percentage between current and past year MTD.
- Actual CY YTD & Target CY YTD: Current Year-to-Date actual vs. target.
- YTD Status Icon: Similar to MTD status, uses indicators to show KPI progress.
- Target vs. Actual (YTD): Percentage difference for Year-to-Date figures.
- PY YD: Previous Year’s Year-to-Date data.
- CY vs. PY (YTD): Percentage comparison between current and previous year YTD.
KPI Trend Page
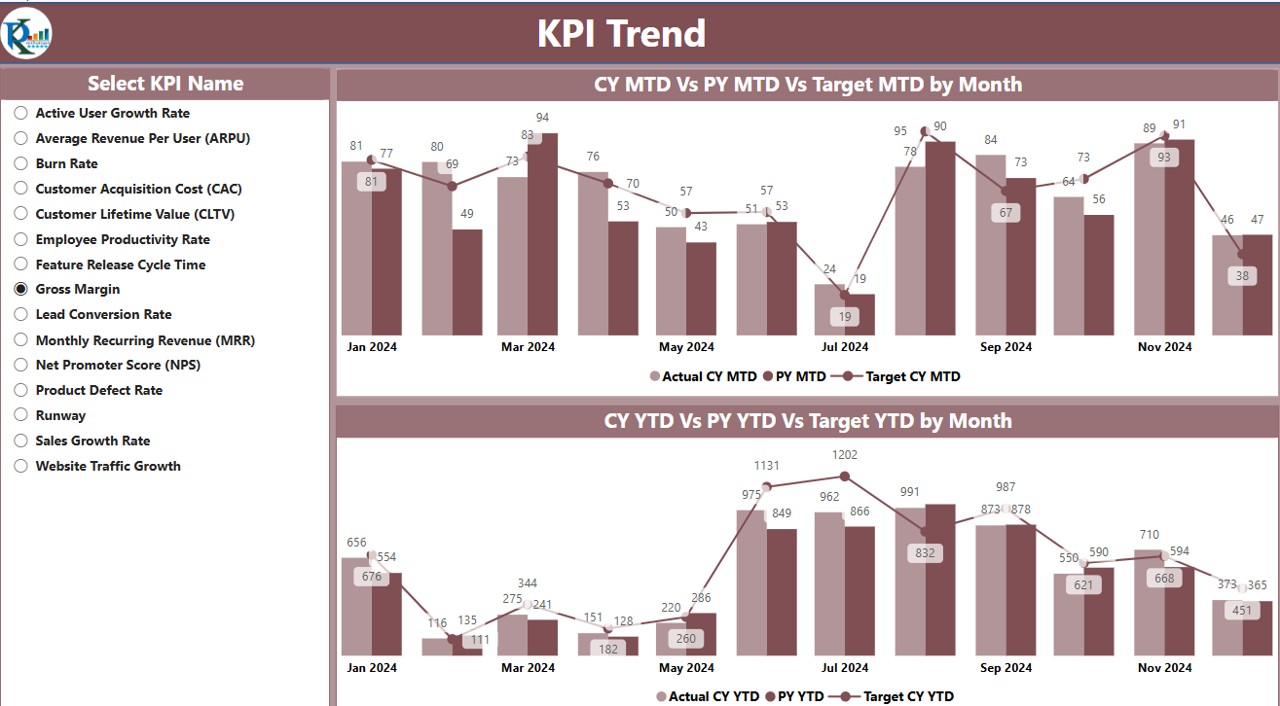
This page includes:
- Two Combo Charts: Displays actual numbers of Current Year, Previous Year, and Targets for MTD and YTD.
- Slicer: Users can select individual KPIs to analyze trends.
KPI Definition Page
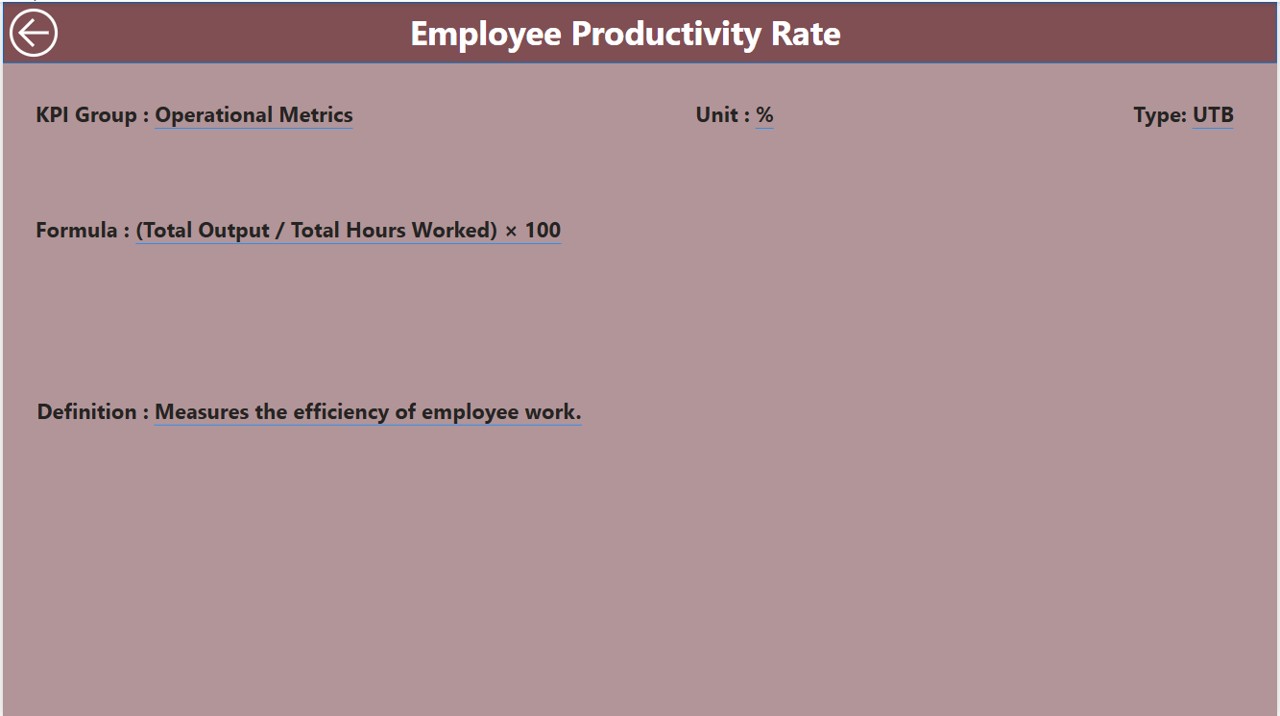
A hidden drill-through page accessible from the Summary Page. It provides:

- KPI Formula
- KPI Definition
- Additional details to understand each metric better.
- To return to the main page, click the Back Button in the top left corner.
Click to Startup Growth KPI
Data Input and Sources
The data for the dashboard is stored in an Excel file with three key worksheets:
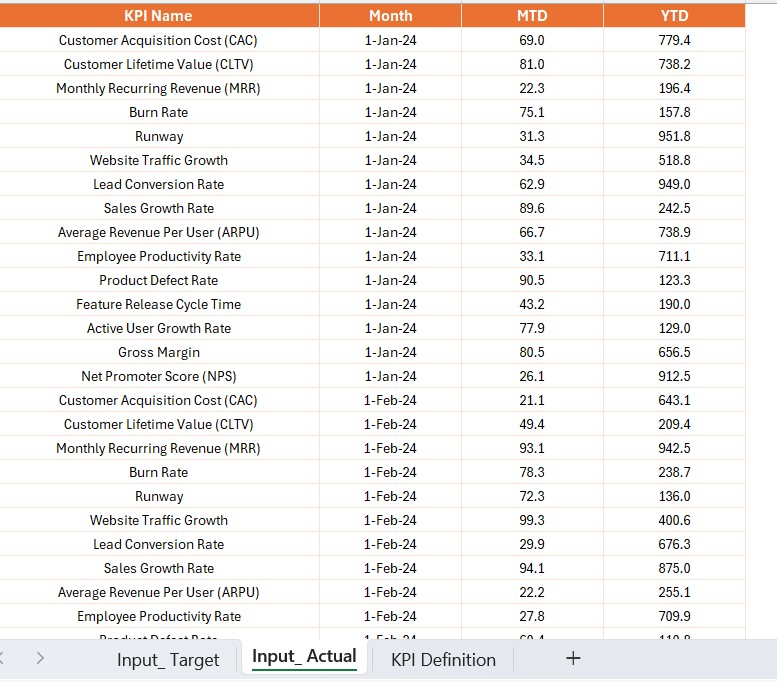
Input Actual Sheet Tab:
- Fill in actual KPI numbers for KPI Name, Month, MTD, and YTD values.
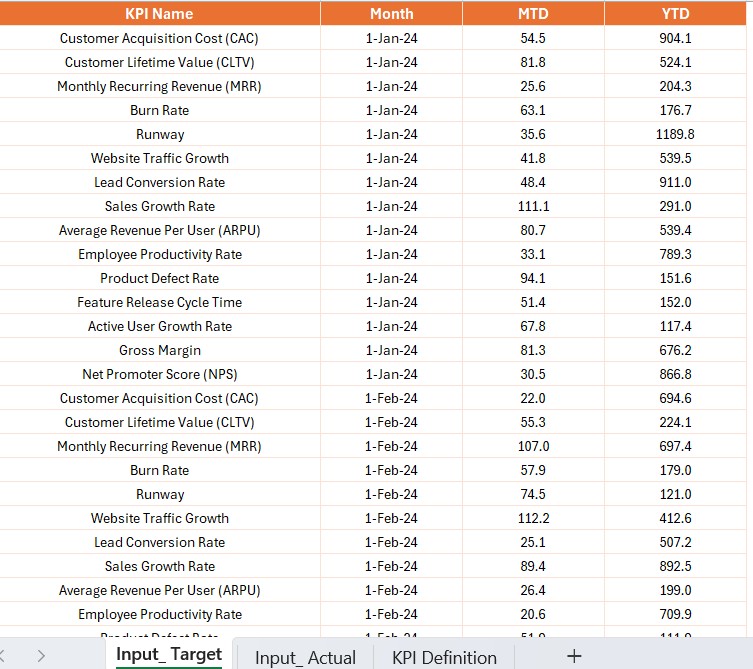
Input Target Sheet Tab:
- Fill in target values for KPI Name, Month, MTD, and YTD numbers.
KPI Definition Sheet:
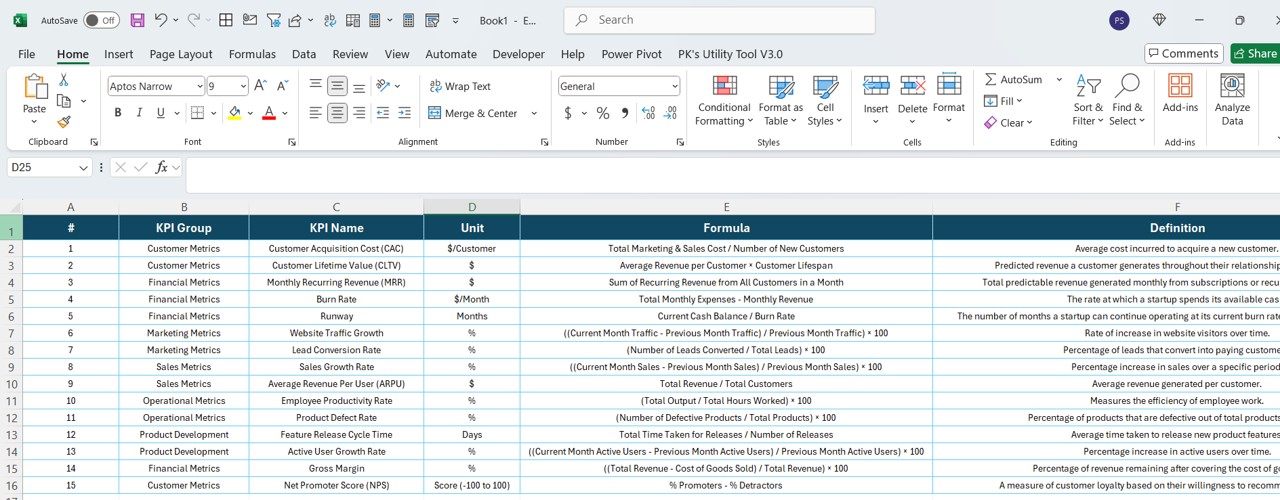
- Input essential details like KPI Number, KPI Group, KPI Name, Unit, Formula, Definition, and Type (LTB/UTB).
Advantages of Using the Startup Growth KPI Dashboard
Real-Time Insights
Get an up-to-date view of startup performance with dynamic visualizations.
Data-Driven Decision Making
Use trend analysis to optimize strategies and resource allocation.
Improved Performance Tracking
Compare actuals vs. targets to identify areas needing improvement.
Customizable KPIs
Adjust KPI types, formulas, and targets as per business needs.
Time-Saving Automation
Eliminate manual reporting with automated Power BI insights.
Best Practices for the Startup Growth KPI Dashboard
Click to Startup Growth KPI
- Ensure Data Accuracy: Regularly update KPI data in the Excel sheets to maintain accuracy.
- Use Consistent Metrics: Define clear KPI definitions to avoid inconsistencies.
- Visualize Effectively: Choose meaningful charts that best represent startup performance.
- Regularly Review KPI Trends: Analyze historical trends to forecast future performance.
- Keep Dashboards User-Friendly: Ensure navigation and data representation are simple for stakeholders.
Conclusion
A Startup Growth KPI Dashboard in Power BI empowers businesses to track their progress effectively. By leveraging real-time analytics, trend insights, and performance tracking, startups can drive data-driven decision-making and improve operational efficiency.
This dashboard simplifies KPI monitoring with visual insights and structured data sources, making it an essential tool for startup growth strategies.
Frequently Asked Questions (FAQs)
What is a Startup Growth KPI Dashboard?
A Startup Growth KPI Dashboard is a data visualization tool that tracks key startup metrics, helping businesses measure performance and make informed decisions.
How do I update KPI data in the dashboard?
Update the Excel sheets (Actual, Target, and KPI Definition tabs) to reflect the latest figures, and refresh the Power BI dashboard.
Can I customize the KPIs in Power BI?
Yes! You can modify KPI formulas, targets, and visualization settings to match your startup’s requirements.
Why is trend analysis important for startups?
Trend analysis helps startups identify performance patterns, forecast future trends, and make proactive business decisions.
How often should I review KPI trends?
It is best to review KPI trends weekly or monthly to ensure timely decision-making and performance optimization.
Click to Startup Growth KPI
Visit our YouTube channel to learn step-by-step video tutorials
View this post on Instagram