In today’s fast-paced financial world, effective wealth management requires robust Key Performance Indicators (KPIs) to track, analyze, and improve financial performance. A Wealth Management KPI Dashboard in Excel provides an interactive, data-driven solution to measure and monitor financial health, enabling wealth managers to make informed decisions efficiently.
Click to Wealth Management KPI
In this article, we will explore the features, advantages, best practices, and FAQs related to using a Wealth Management KPI Dashboard in Excel.
What is a Wealth Management KPI Dashboard in Excel?
A Wealth Management KPI Dashboard in Excel is a ready-to-use template designed to track financial metrics essential for effective wealth management. This dashboard consolidates real-time data, trends, and performance insights, helping financial professionals manage assets, liabilities, and overall financial goals.
The dashboard consists of seven key worksheets, each serving a specific purpose to streamline wealth management KPIs.
Key Features of the Wealth Management KPI Dashboard
Home Sheet
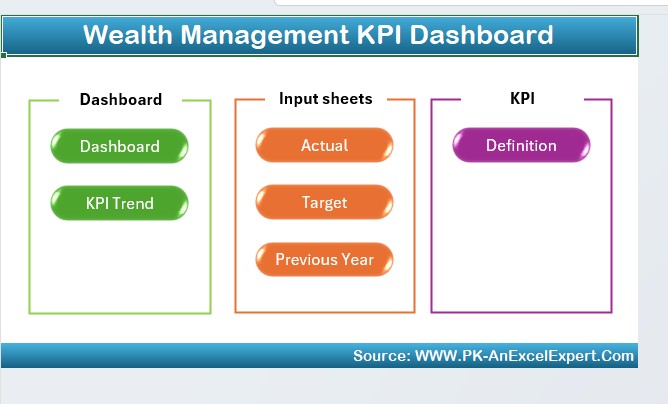
- Acts as the main navigation index for the dashboard.
- Contains six interactive buttons to access various sheets instantly.
Click to Wealth Management KPI
Dashboard Sheet (Main Performance Overview)
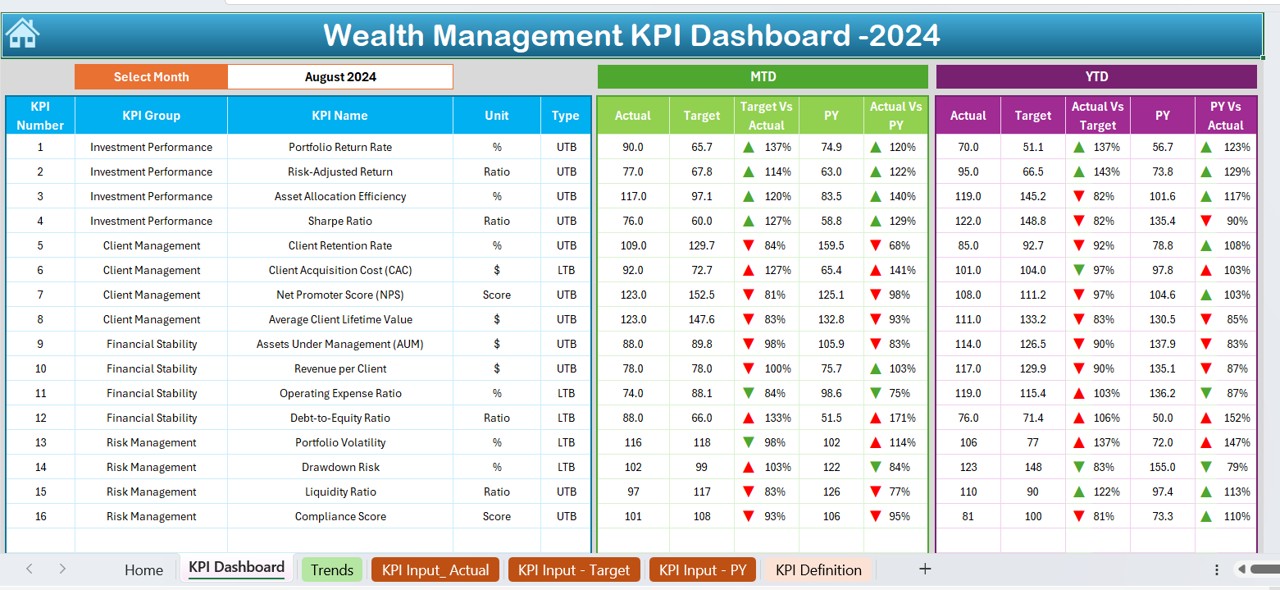
- Displays MTD (Month-to-Date) and YTD (Year-to-Date) data.
- Provides interactive dropdown to select the desired month (Range D3).
- Updates all dashboard numbers dynamically based on the selected month.
- Shows Target vs. Actual and Previous Year (PY) vs. Actual data with conditional formatting and up/down arrows.
KPI Trend Sheet (Performance Analysis)
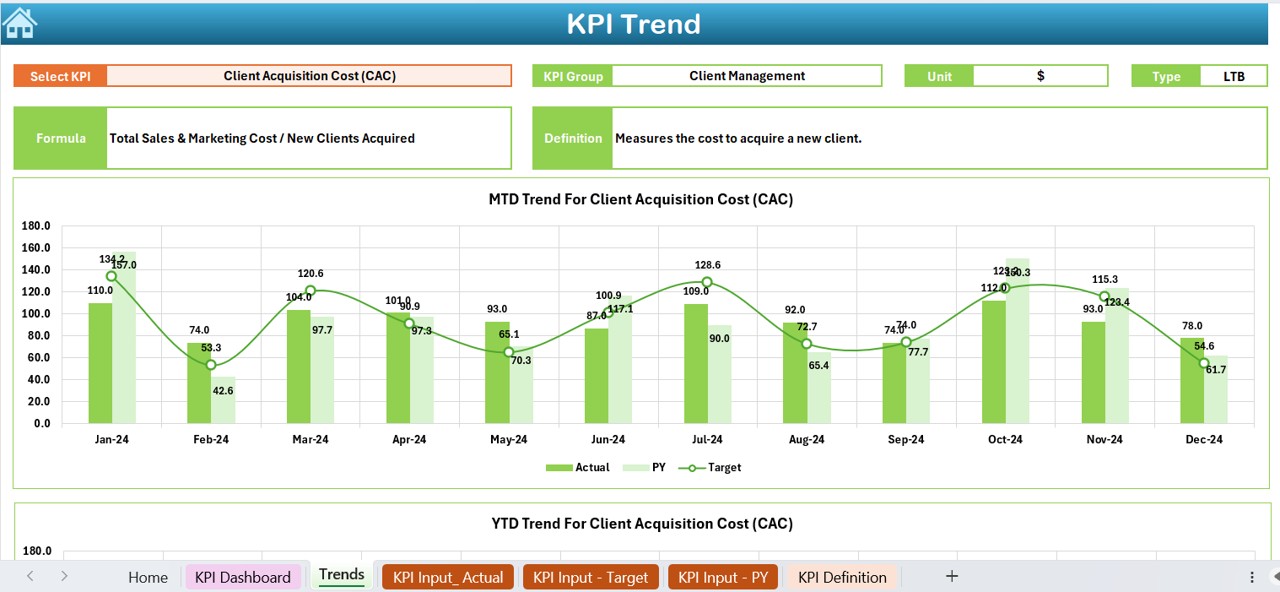
- Allows selection of specific KPIs via dropdown (Range C3).
- Displays KPI details like Group, Unit, Type (Lower or Upper better), Formula, and Definition.
- Provides trend charts for MTD and YTD values.
Click to Wealth Management KPI
Actual Numbers Input Sheet
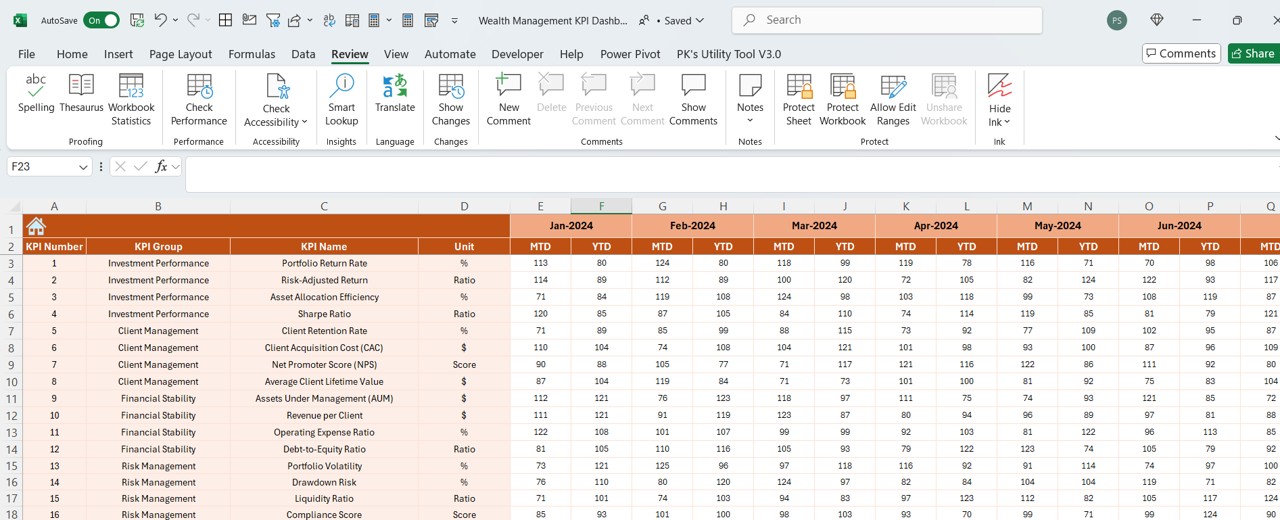
- Input monthly actual financial data (both MTD and YTD).
- Change the starting month dynamically (Range E1).
Target Sheet
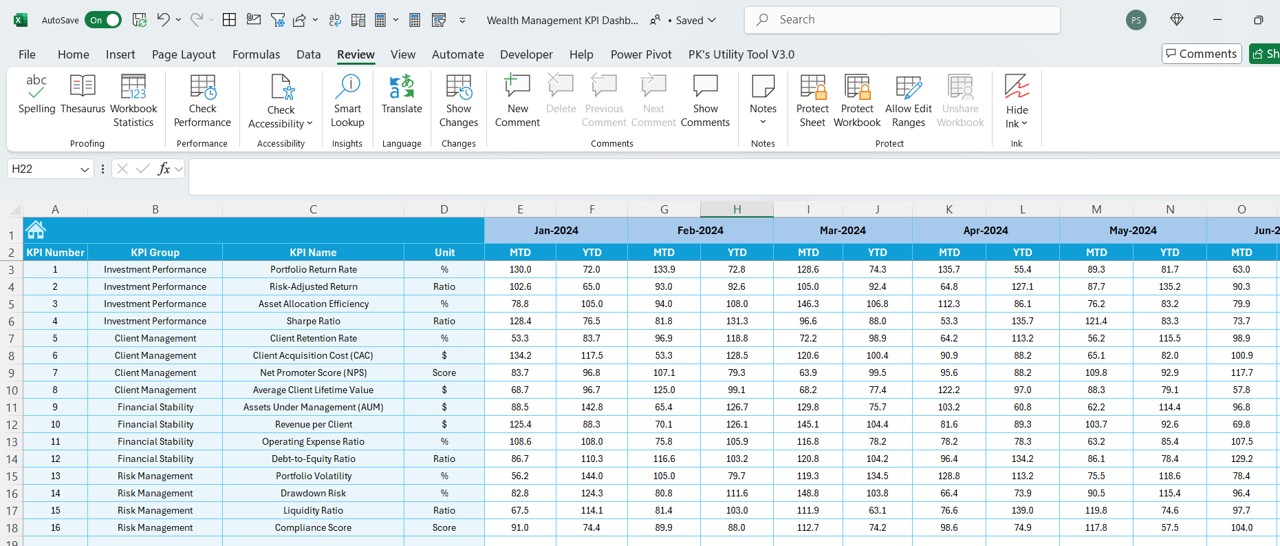
- Enter monthly target values for each KPI.
- Input both MTD and YTD target numbers.
Previous Year Numbers Sheet
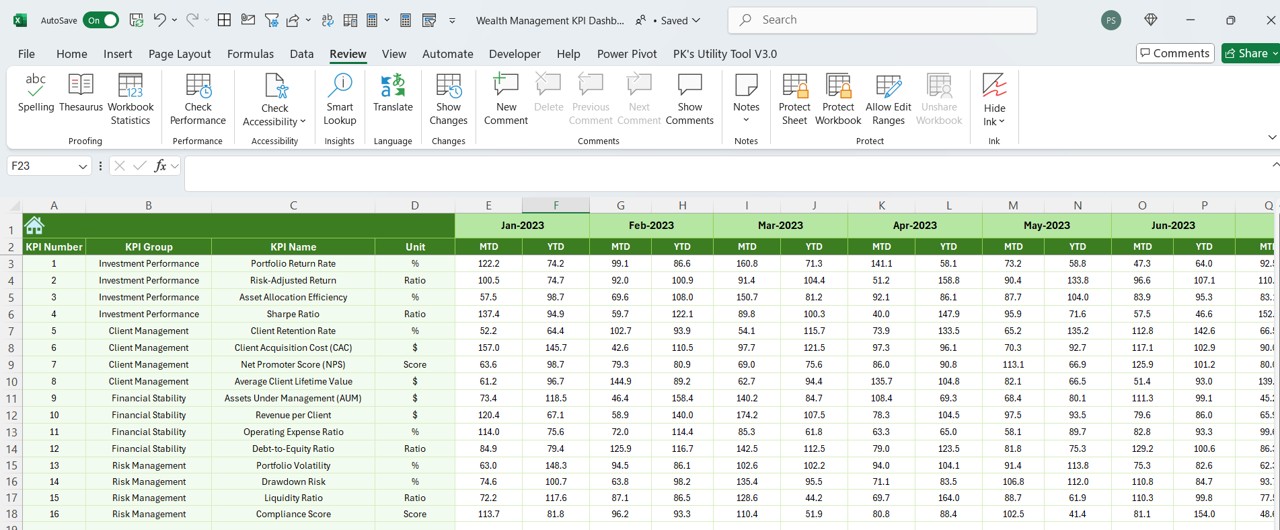
- Stores historical financial performance data for year-on-year comparison.
KPI Definition Sheet
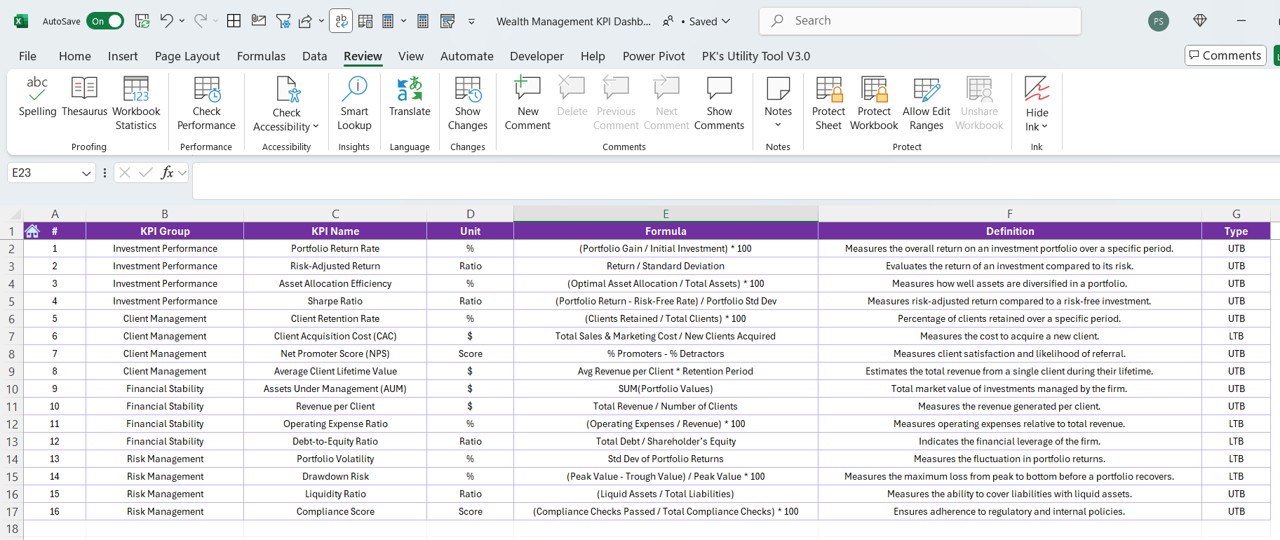
- Define each KPI with name, group, unit, formula, and meaning.
Advantages of a Wealth Management KPI Dashboard
- Real-Time Performance Tracking: Monitor financial KPIs dynamically with interactive charts and trend analysis.
- Data-Driven Decision Making: Enables financial managers to make informed investment decisions using structured data.
- Improved Financial Planning: Helps in setting clear financial targets and tracking their progress over time.
- Better Visualization & Insights: Provides intuitive charts, conditional formatting, and KPI trend graphs for deeper insights.
- Historical Data Comparison: Enables comparison of previous year vs. current performance to track financial growth.
- Time-Saving Automation: Eliminates the need for manual financial reporting, reducing errors and saving time.
Best Practices for Using a Wealth Management KPI Dashboard
- Define Clear KPIs: Ensure that each KPI has a clear purpose and is aligned with financial goals.
- Regularly Update Data: Update the actual, target, and previous year data monthly to maintain accuracy.
- Use Conditional Formatting: Apply color coding, up/down arrows, and alerts to highlight performance trends.
- Analyze Trends Over Time: Use the KPI trend sheet to assess MTD and YTD patterns, making proactive financial decisions.
- Automate Data Input with Formulas: Leverage Excel formulas (SUMIF, INDEX-MATCH, XLOOKUP, etc.) to automate calculations.
- Customize Dashboard to Fit Needs: Modify the template layout, color schemes, and chart types to align with specific business needs.
Click to Wealth Management KPI
Frequently Asked Questions (FAQs)
What are the essential KPIs to track in wealth management?
- Some important Wealth Management KPIs include:
- Net Worth Growth
- Investment Returns (%)
- Portfolio Diversification Ratio
- Debt-to-Income Ratio
- Expense-to-Income Ratio
How does the Wealth Management KPI Dashboard help financial professionals?
The dashboard provides real-time insights, automated reporting, and trend analysis, helping financial advisors make data-driven decisions.
Can I customize the KPI dashboard as per my needs?
Yes! The Excel template is fully customizable. You can add new KPIs, modify formulas, or integrate additional data sources.
Is it necessary to have advanced Excel skills to use this dashboard?
No. The template is designed for ease of use, and basic Excel knowledge is sufficient. However, familiarity with Excel formulas and pivot tables can enhance usability.
How frequently should I update my KPI dashboard?
It is recommended to update data monthly to track financial performance accurately and efficiently.
Conclusion
A Wealth Management KPI Dashboard in Excel is an essential tool for financial professionals and individuals looking to track, analyze, and optimize their financial performance. With its interactive features, trend analysis, and automation, this dashboard simplifies financial management while enhancing decision-making.
Click to Wealth Management KPI
Visit our YouTube channel to learn step-by-step video tutorials
View this post on Instagram