Managing an ATM network efficiently requires tracking multiple key performance indicators (KPIs) in real-time. Our ATM Network KPI Dashboard in Excel is a ready-to-use, fully automated tool designed to help banks and financial institutions monitor ATM performance, optimize operations, and improve service quality.
Key Features:
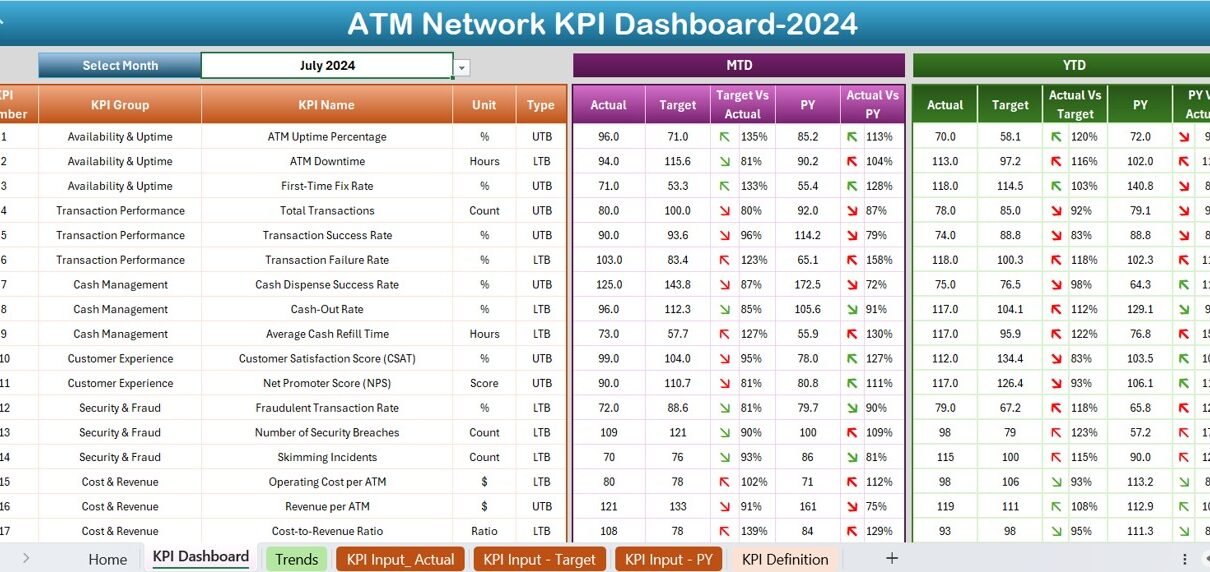
7 Comprehensive Dashboard:
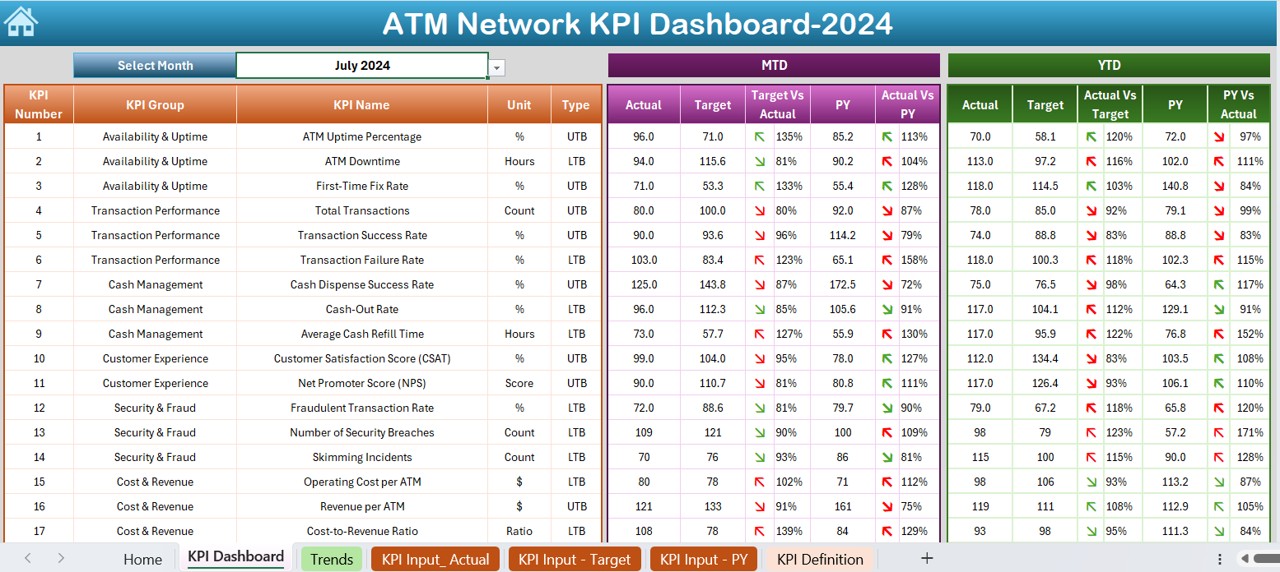
View MTD and YTD performance with actual, target, and previous year comparisons using conditional formatting with up/down arrows.
Dynamic KPI Trend Analysis:
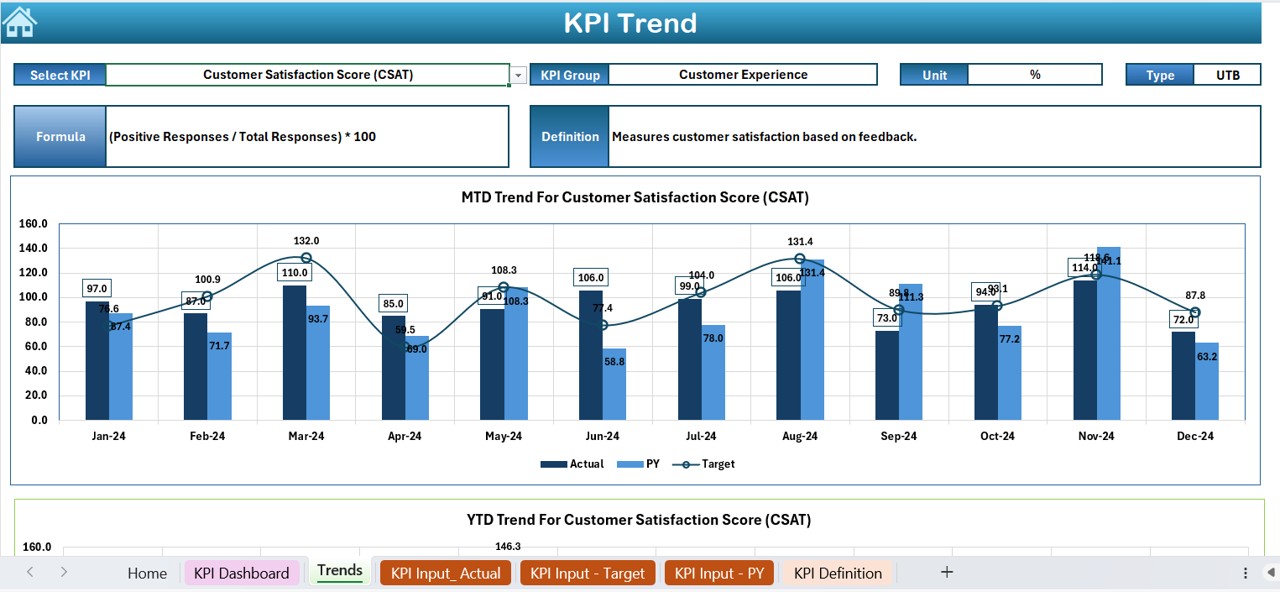
Select a KPI to visualize trends with interactive drop-downs and detailed trend charts.
Automated Data Inputs:

Easily input actual numbers, targets, and previous year data in structured sheets.
User-Friendly Navigation:
Home sheet with quick-access buttons for seamless navigation across all tabs.
Customizable KPI Definitions:
Define KPI formulas, units, and types (Lower the Better or Upper the Better) for accurate reporting.
Month-Wise Selection:
Update numbers dynamically by selecting the desired month, instantly refreshing all KPI values.