In today’s data-driven world, organizations rely on Key Performance Indicators (KPIs) to measure performance and efficiency. The Shared Services KPI Dashboard in Power BI is a powerful tool that provides insights into operational metrics, helping businesses make informed decisions. This article will guide you through the key features, advantages, best practices, and FAQs related to this dashboard.
Click to Shared Services KPI
What is a Shared Services KPI Dashboard?
A Shared Services KPI Dashboard is a reporting tool designed to track and measure the efficiency of shared service operations within an organization. This dashboard integrates with Power BI, offering real-time visualizations and detailed analytics to help monitor KPIs effectively.
Key Features of the Shared Services KPI Dashboard
This Power BI dashboard consists of three main pages, each providing a unique view of KPI performance:
Click to Shared Services KPI
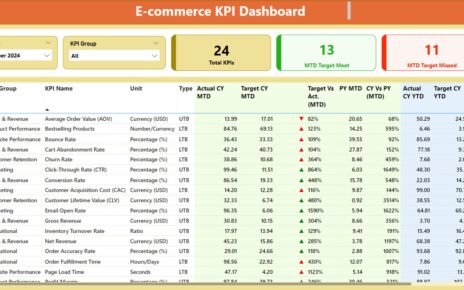
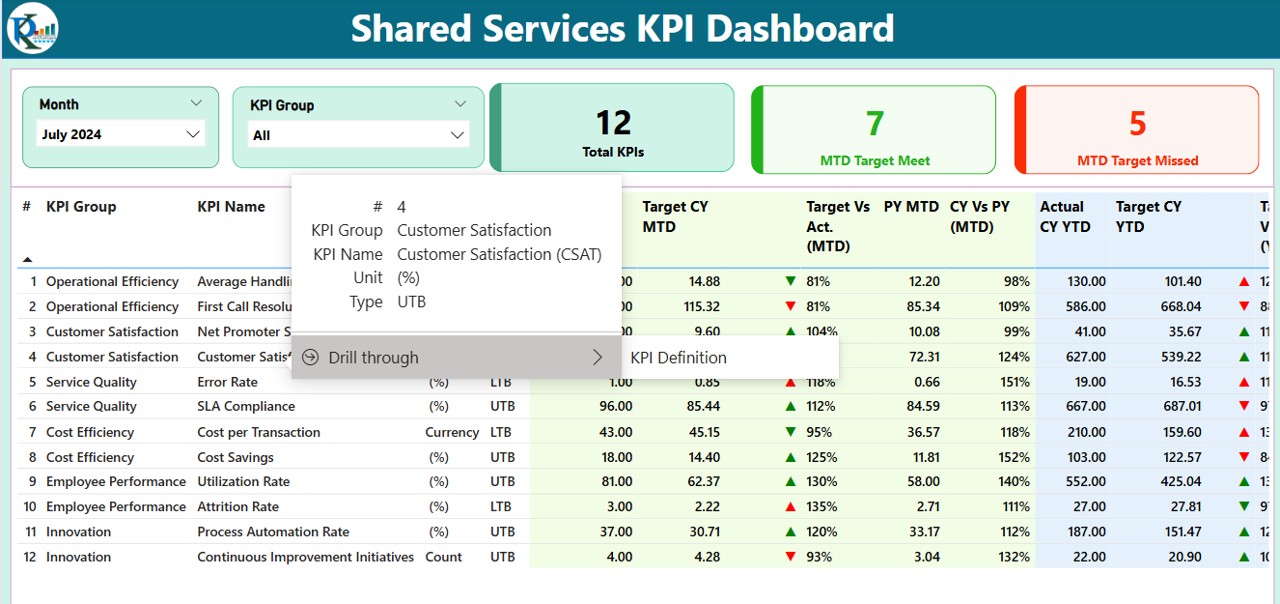
Summary Page
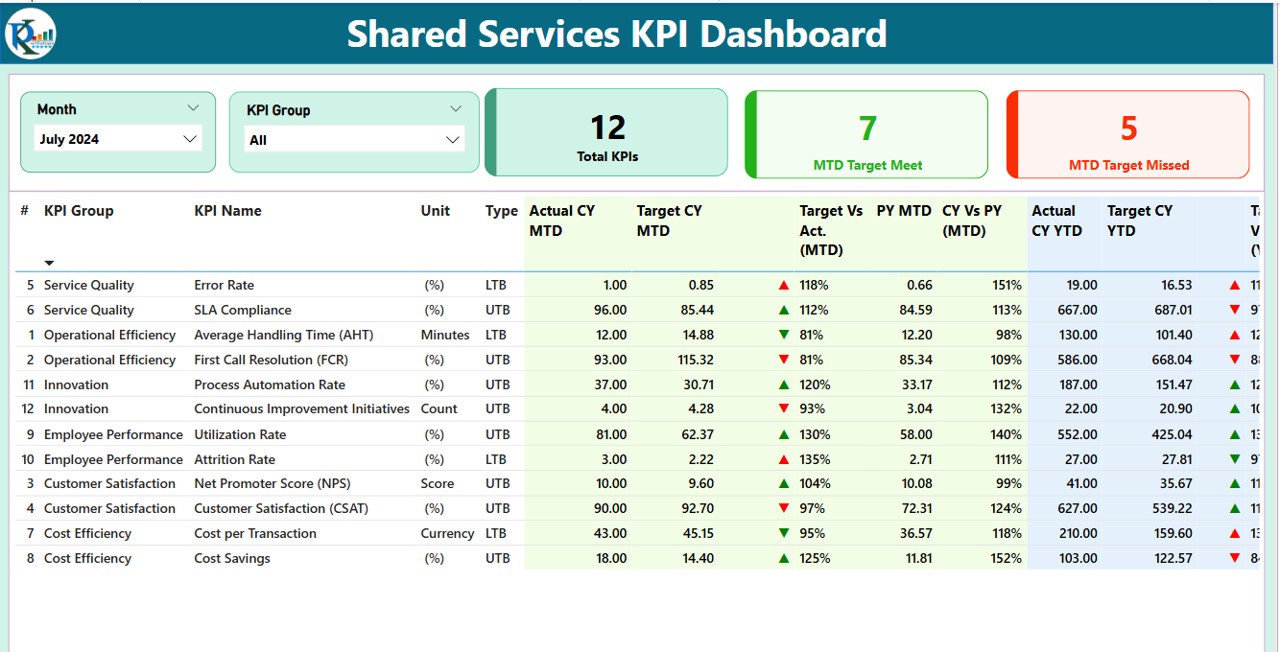
This is the main page of the dashboard, displaying an overview of the most crucial KPIs. It includes:
- Month and KPI Group Slicer – Allows users to filter KPIs by month and group.
- Summary Cards – Displays key statistics, including:
- Total KPIs Count
- MTD Target Met Count
- MTD Target Missed Count
- Detailed KPI Table – Shows critical data such as:
- KPI Number, KPI Group, KPI Name, and Unit of Measurement.
- Type of KPI (Lower the Better – LTB or Upper the Better – UTB).
- Actual vs Target values for MTD and YTD.
- MTD and YTD Indicators (Green ▲ for met targets, Red ▼ for missed targets).
- Target vs. Actual percentage comparisons.
- Year-over-Year (YoY) comparisons for MTD and YTD.
Click to Shared Services KPI
KPI Trend Page
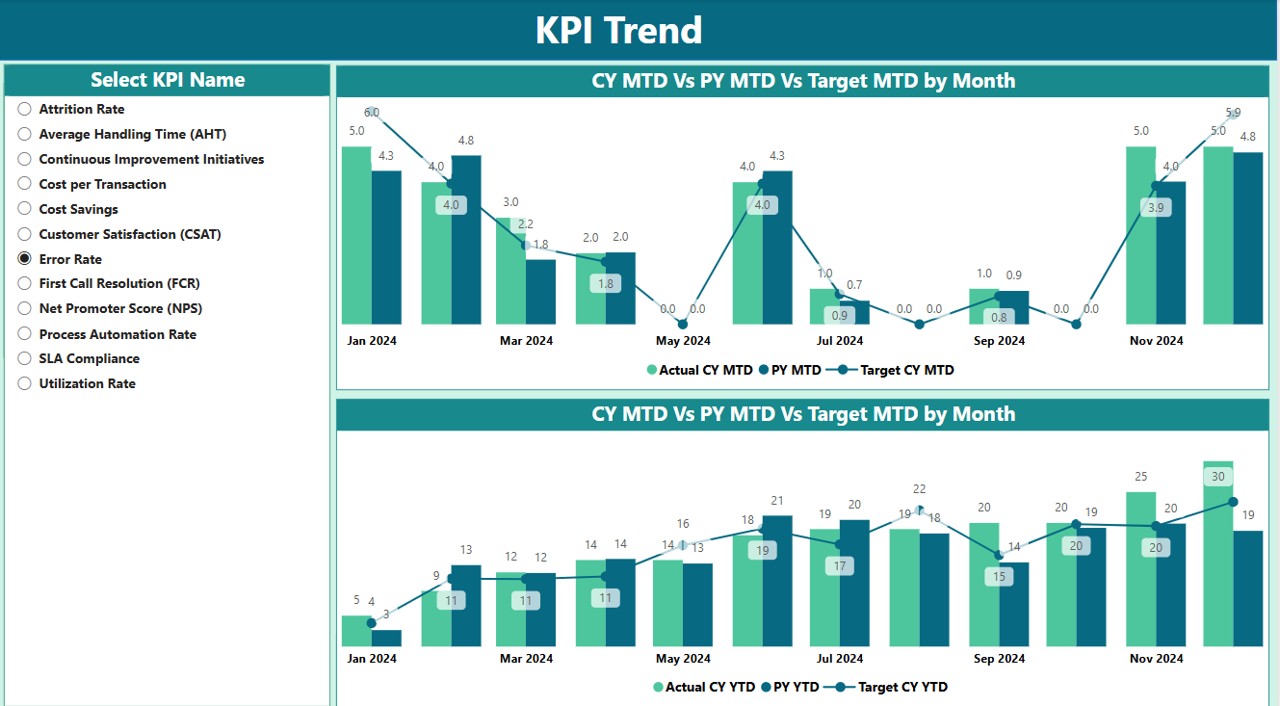
This page provides visual trend analysis using combo charts to track KPI performance over time. Features include:
- Charts for MTD and YTD comparisons – Displays current year, previous year, and target values.
- Slicer to select specific KPIs – Allows in-depth trend analysis for a chosen KPI.
KPI Definition Page
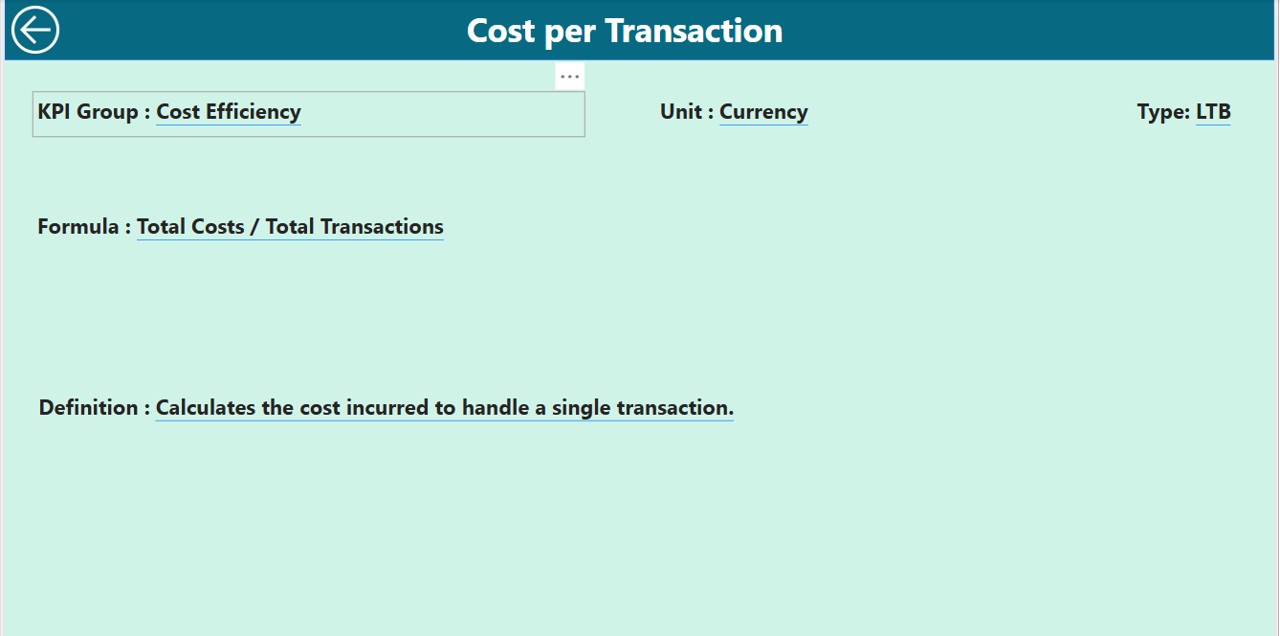
A drill-through page, which remains hidden until accessed from the Summary Page. This section contains:
- Formula and Definition of KPIs – Helps users understand how each KPI is calculated.
- Back Button – A simple navigation button to return to the Summary Page.
Data Source: Excel Integration
The dashboard is powered by an Excel data source with three worksheets:
Input Actual Sheet
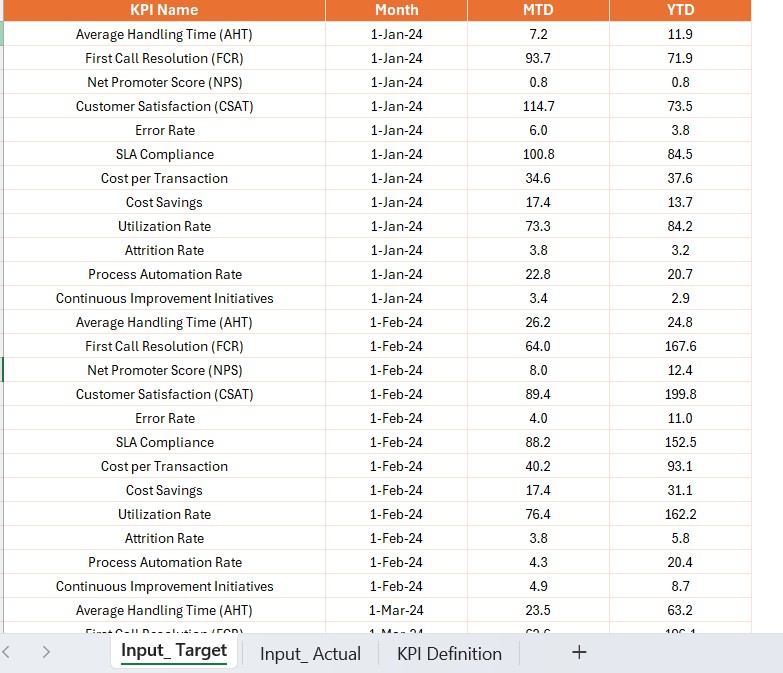
- Captures actual KPI values for each month (MTD and YTD).
Input Target Sheet
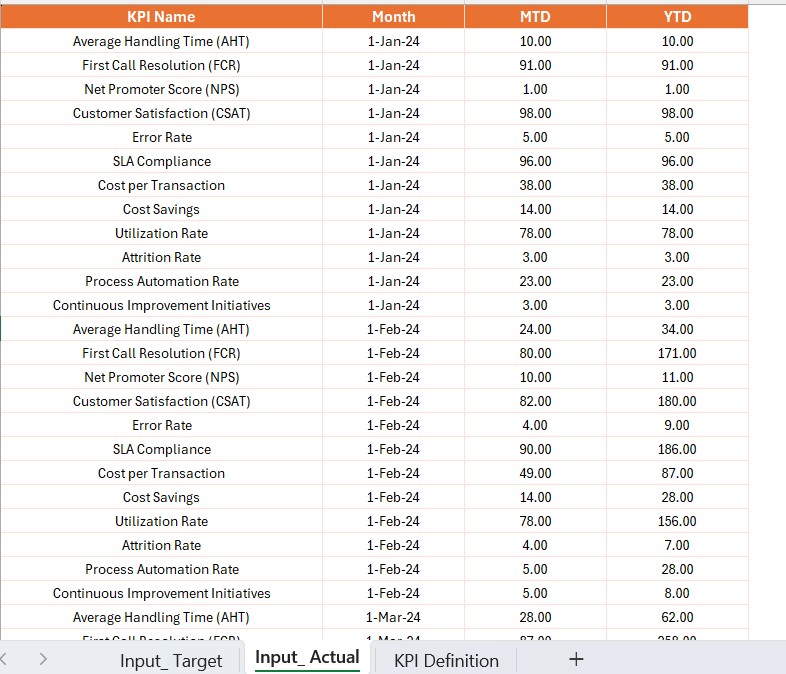
- Stores target KPI values for each month (MTD and YTD).
Click to Shared Services KPI
KPI Definition Sheet
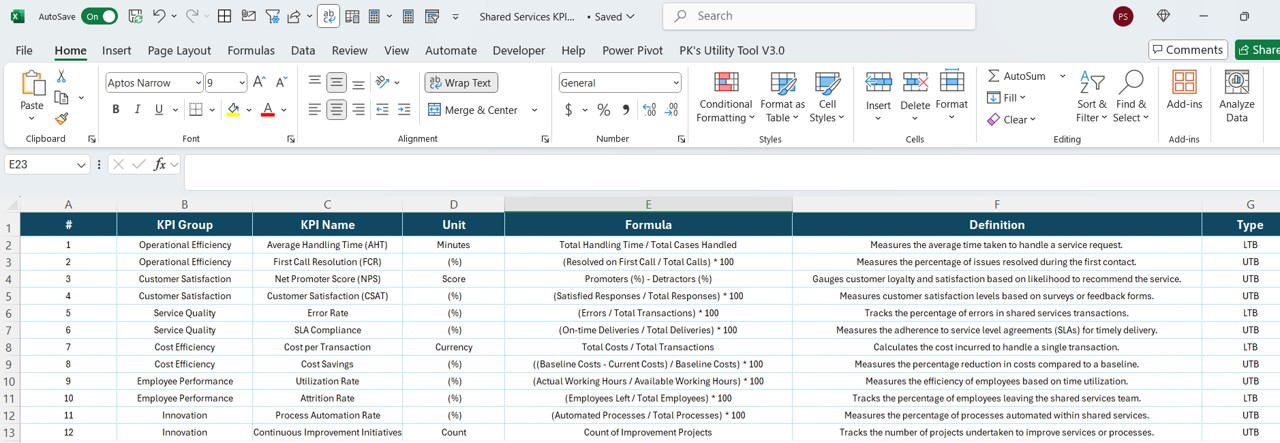
- Contains KPI details such as KPI Number, KPI Group, KPI Name, Unit, Formula, Definition, and Type (LTB/UTB).
Advantages of Using the Shared Services KPI Dashboard
- Enhanced Decision-Making: Provides a data-driven approach to monitoring performance.
- Real-Time Insights: Power BI offers real-time data updates for accurate tracking.
- Customization: Users can modify KPI definitions and targets based on business needs.
- Easy Visualization: Graphs, slicers, and trend charts improve data understanding.
- User-Friendly Interface: Simple navigation with interactive drill-through features.
Best Practices for Using the KPI Dashboard
- Ensure Data Accuracy – Regularly update the Excel file to reflect accurate values.
- Use KPI Filters Effectively – Utilize slicers to focus on specific KPI groups.
- Monitor Trends Continuously – Analyze KPI trends over time for better forecasting.
- Leverage Drill-Through Functionality – Utilize the hidden KPI Definition Page for deeper insights.
- Optimize Performance – Ensure smooth Power BI operations by reducing excessive data load.
Click to Shared Services KPI
Conclusion
The Shared Services KPI Dashboard in Power BI is an invaluable tool for tracking business performance and making informed decisions. With its robust features and intuitive design, it streamlines KPI monitoring, allowing businesses to stay on top of their objectives.
Frequently Asked Questions (FAQs)
What is the purpose of a Shared Services KPI Dashboard?
A Shared Services KPI Dashboard helps organizations track and improve operational efficiency by measuring KPIs in real-time using Power BI.
Can I customize the KPIs in the dashboard?
Yes, you can customize KPI names, targets, and definitions by modifying the Excel data source.
How often should I update the Excel file?
It is recommended to update the Excel file monthly to ensure accurate and up-to-date KPI tracking.
How do I navigate back to the Summary Page from the KPI Definition Page?
Simply click the Back Button located in the top left corner of the KPI Definition Page.
What are the main benefits of integrating Power BI with a KPI Dashboard?
Power BI offers real-time analytics, interactive visuals, and seamless Excel integration, making it a powerful tool for KPI tracking.
Click to Shared Services KPI
Visit our YouTube channel to learn step-by-step video tutorials
View this post on Instagram