The Shared Services KPI Dashboard in Power BI is a ready-to-use solution designed to track and analyze key performance indicators (KPIs) for shared services. It seamlessly integrates Excel data with Power BI, offering an interactive and dynamic visualization of KPIs, helping organizations monitor performance trends, compare targets, and enhance decision-making.
Key Features:
Three Interactive Pages
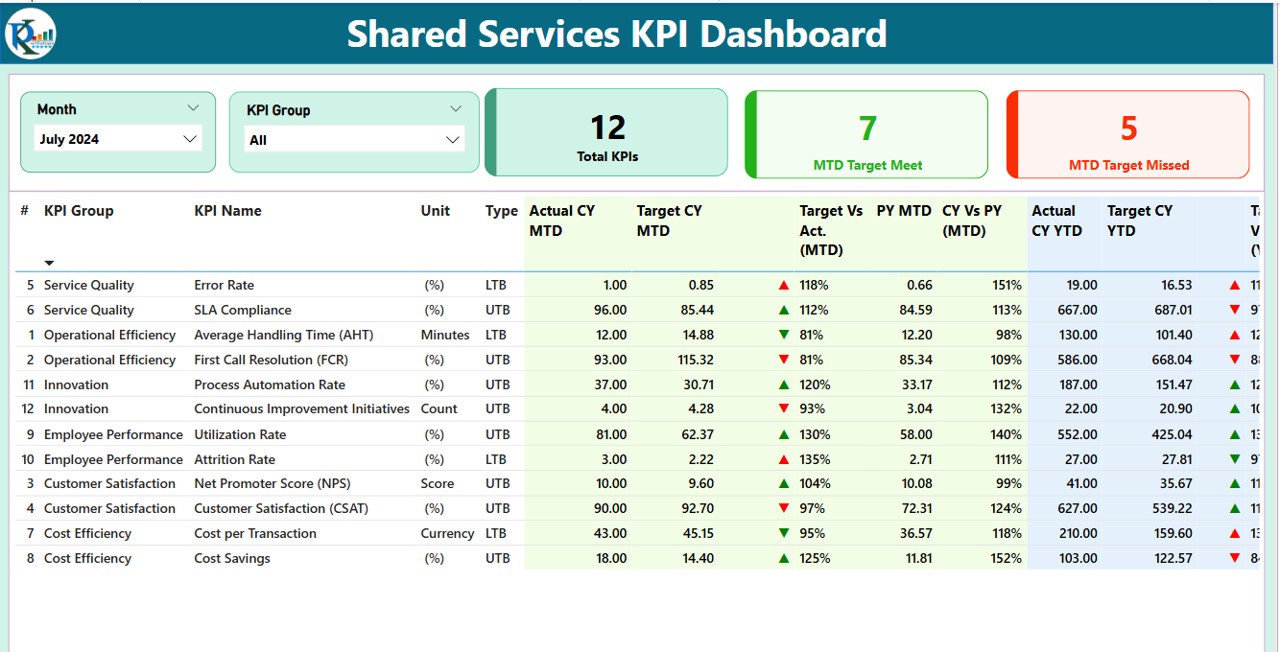
- Summary, KPI Trend, and KPI Definition pages for comprehensive KPI analysis.
Real-Time KPI Monitoring
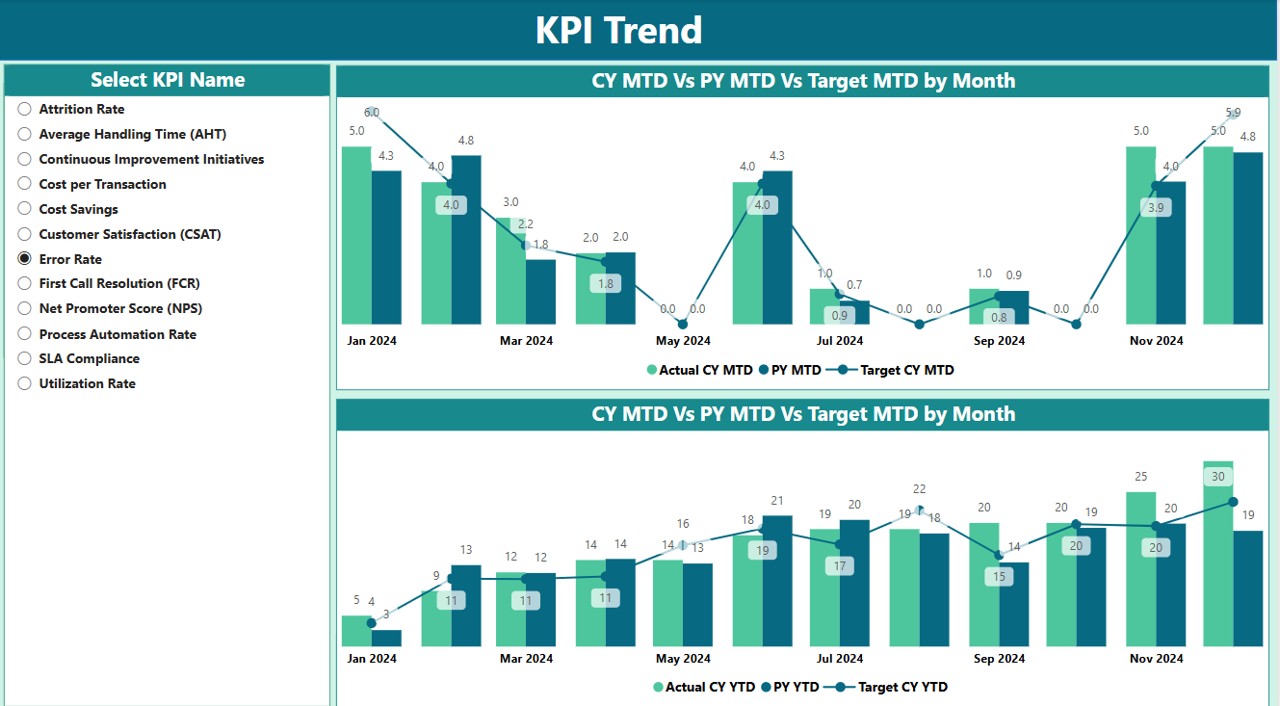
- Track MTD and YTD targets, compare with previous years, and analyze performance trends.
Dynamic Slicers & Visuals
- Filter by Month and KPI Group, with easy-to-read trend charts and drill-through details.
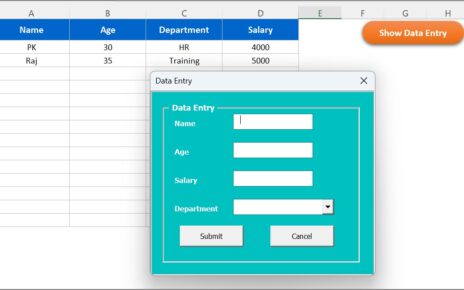
Excel Data Source Integration
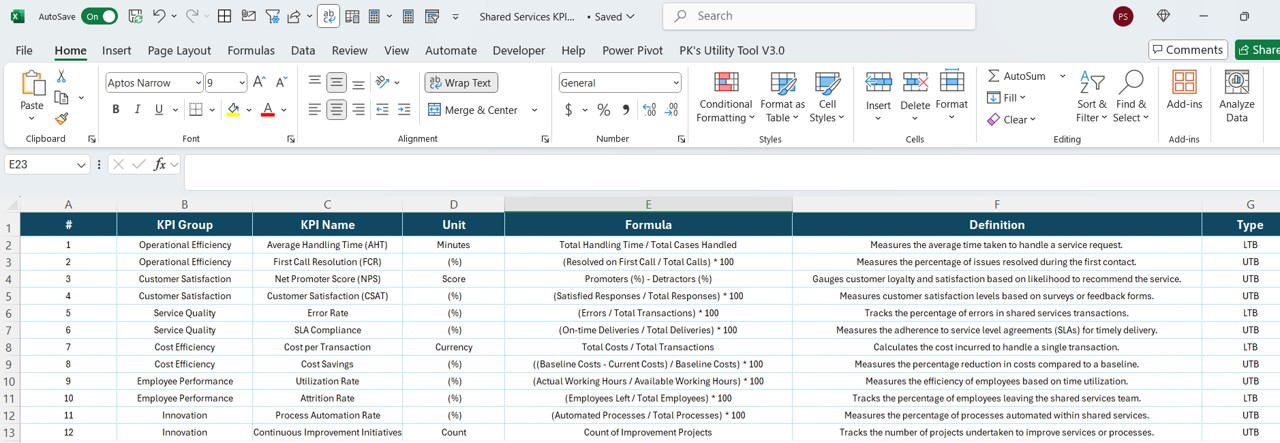
- Seamlessly update KPIs through structured Excel sheets for Actuals, Targets, and Definitions.
Visual Indicators for KPI Status
- ▲ Green for met targets, ▼ Red for missed targets, ensuring quick insights at a glance.
Drill-Through KPI Details
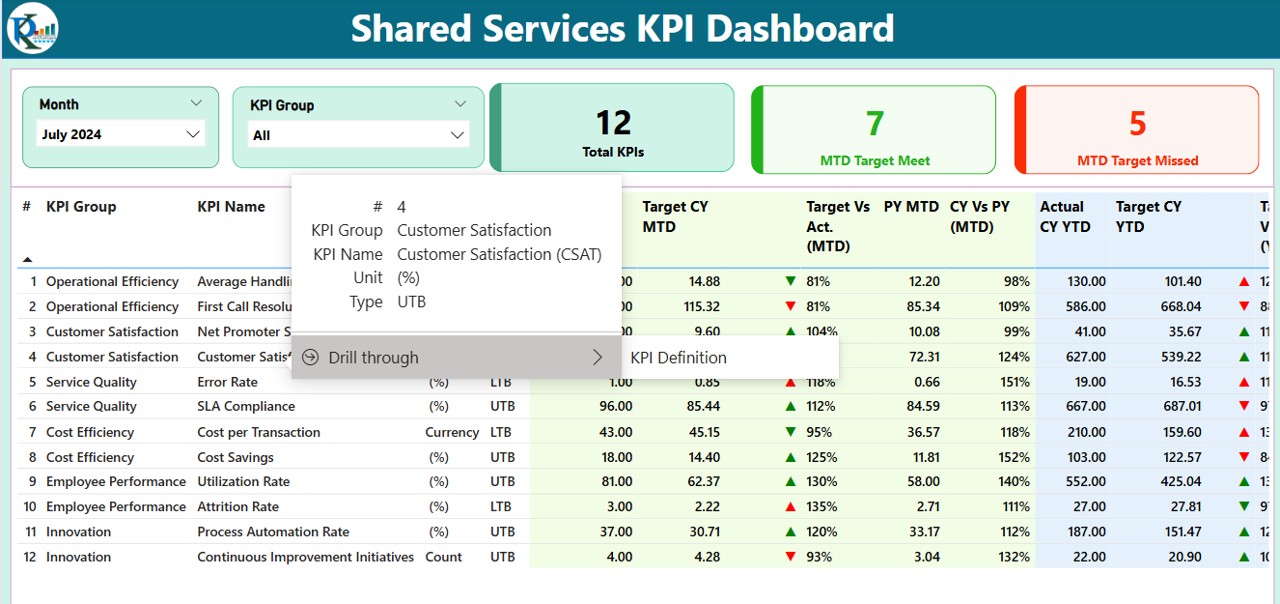
- Access KPI definitions, formulas, and historical comparisons for deeper analysis.
User-Friendly Navigation
- Intuitive interface with a back button for quick access between dashboard pages.