In today’s fast-paced tech environment, ensuring high-quality code is essential to meet user expectations and stay competitive. With the increasing complexity of software applications, managing code quality becomes a challenging but necessary task. This is where Code Quality KPI Dashboards come in. By tracking various key performance indicators (KPIs), these dashboards provide insights into code quality and performance, helping developers, testers, and managers identify areas for improvement.
In this article, we will explore everything you need to know about creating and using a Code Quality KPI Dashboard. From the key KPIs to track, their definitions, formulas, and units, to the best practices and opportunities for improvement, this guide will cover it all.
What is a Code Quality KPI Dashboard?
A Code Quality KPI Dashboard is a visual tool that allows teams to monitor the health of their codebase through a series of predefined KPIs. It helps ensure that the code being developed adheres to quality standards, is free from bugs, and is maintainable in the long run.
KPIs such as test coverage, code complexity, defect density, and the number of code reviews can be tracked in this dashboard. This real-time feedback allows development teams to make data-driven decisions and continuously improve the code quality.
Key Features of the Code Quality KPI Dashboard
This dashboard comes as a ready-to-use template that can be customized according to your project needs. The Code Quality KPI Dashboard includes seven essential worksheets:
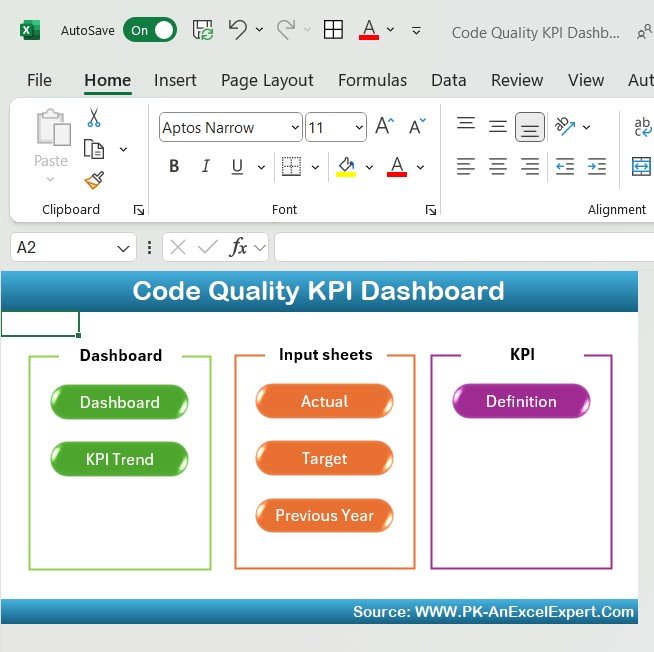
Home Sheet:
This is the index sheet where users can easily navigate to the other sections. It provides six buttons to jump directly to the respective sheets.
Click to Purchase Code Quality KPI Dashboard in Excel
Dashboard Sheet Tab:
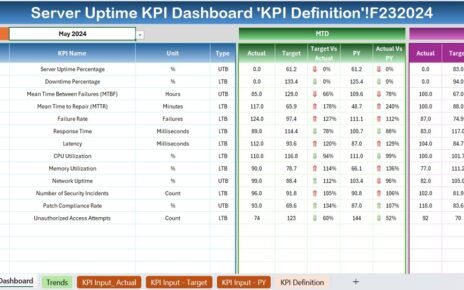
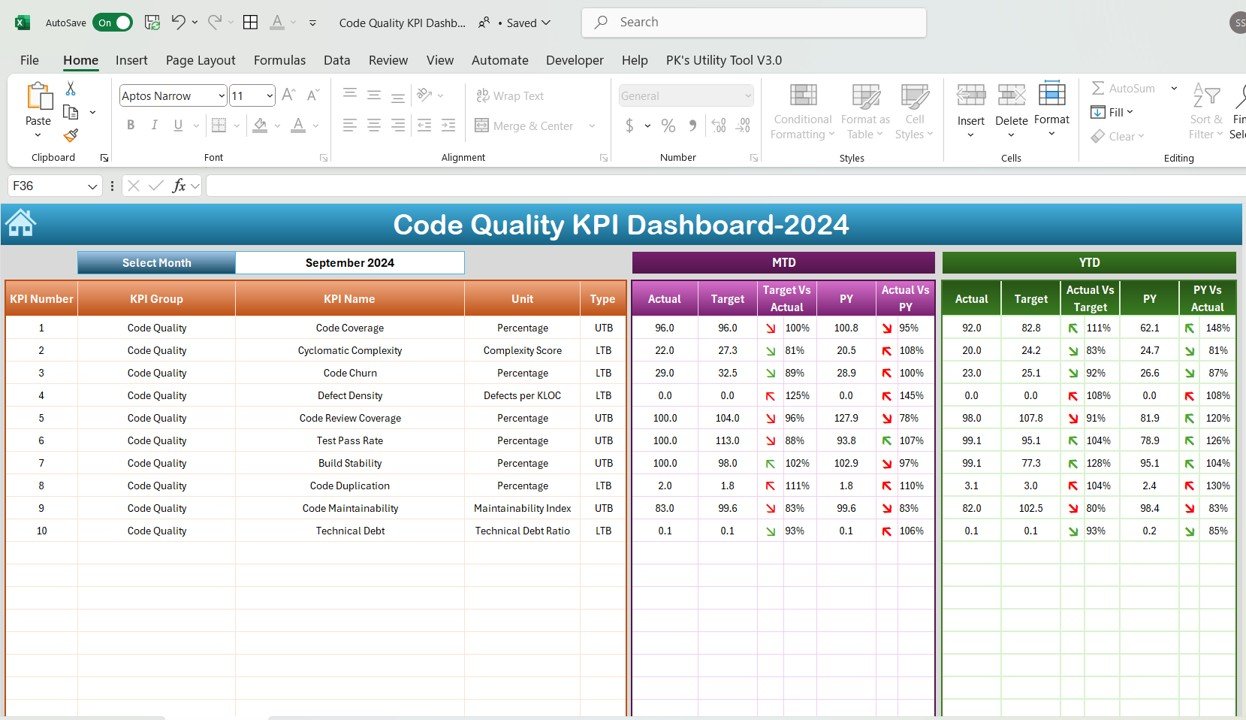
This is the main sheet that displays information about all the KPIs. It features a drop-down menu where you can select the month, and the entire dashboard updates with the data for that month. The sheet includes:
- MTD (Month to Date): Actual, Target, and Previous Year (PY) data
- YTD (Year to Date): Actual, Target, and Previous Year data
- Target vs Actual and PY vs Actual comparisons
- Conditional formatting (Up/Down arrows) to highlight performance deviations
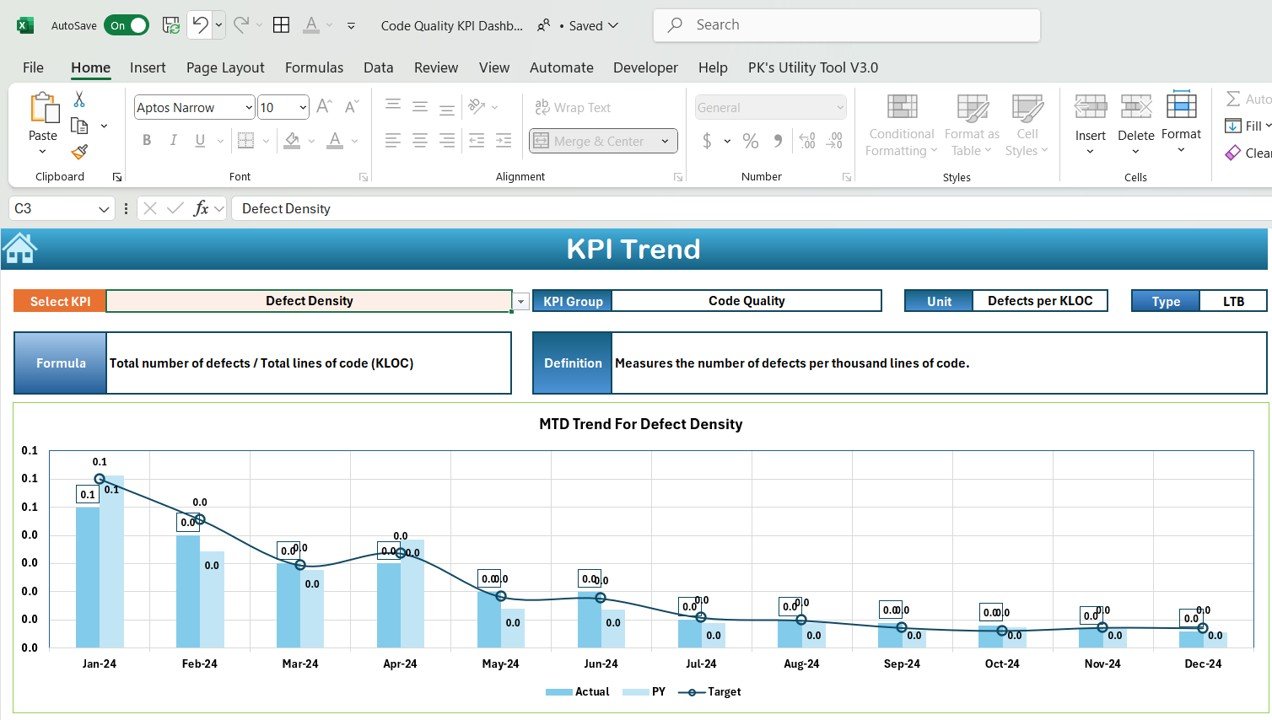
KPI Trend Sheet Tab:
This sheet provides a drop-down menu to select the KPI name. It displays:
- KPI Group
- Unit of KPI
- Type of KPI (Lower the better, Upper the better)
- Formula for KPI calculation
- Definition of each KPI
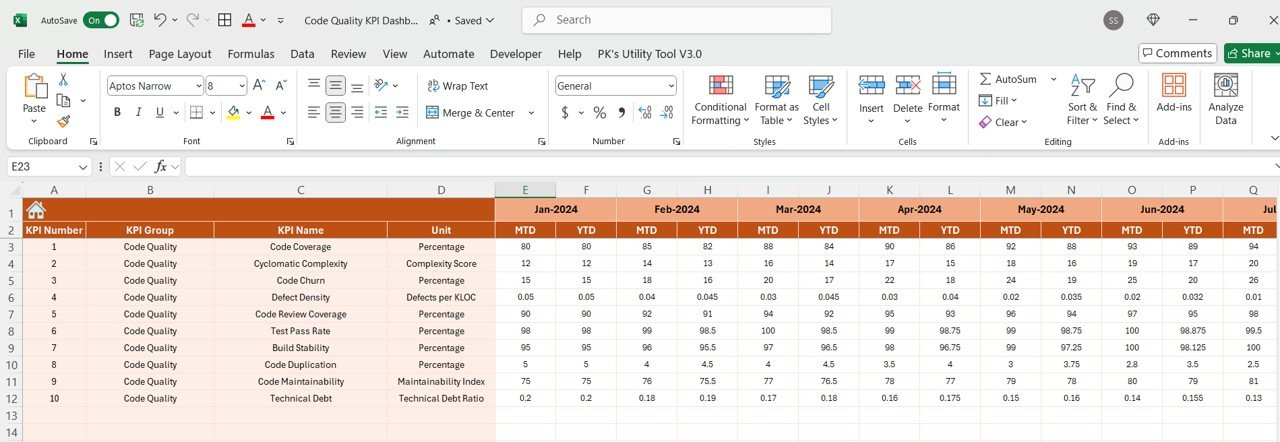
Actual Number Sheet Tab:
This tab is used to input the actual numbers for both YTD and MTD. It also allows you to change the month for reporting.
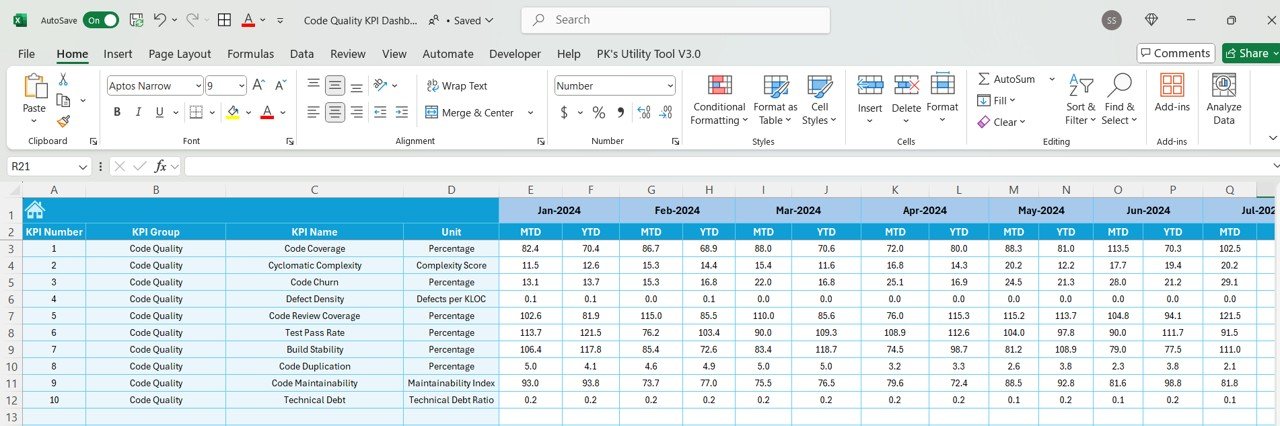
Target Sheet Tab:
Here, you enter the target numbers for each KPI for the particular month (MTD and YTD).
Click to Purchase Code Quality KPI Dashboard in Excel
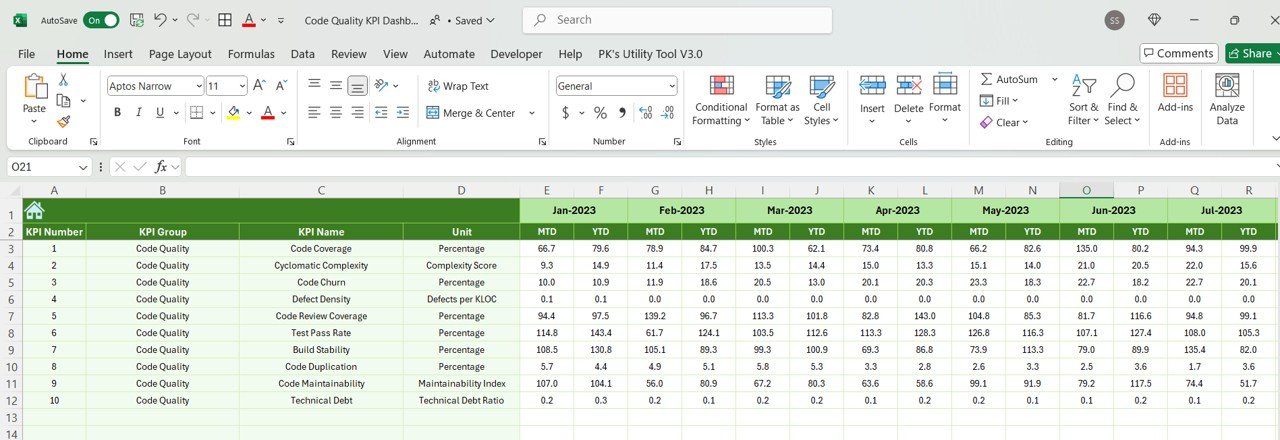
Previous Year Number Sheet Tab:
In this sheet, you input the previous year’s numbers to compare with the current year’s performance.
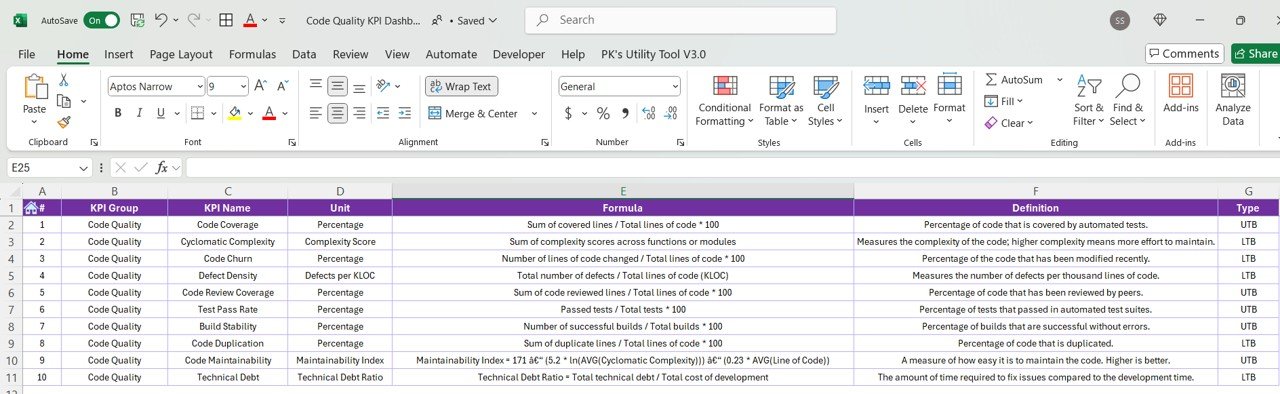
KPI Definition Sheet Tab:
This sheet contains detailed information about each KPI, including:
- KPI Name
- KPI Group
- Unit of Measurement
- Formula for KPI calculation
- Detailed KPI definition
Click to Purchase Code Quality KPI Dashboard in Excel
Advantages of Code Quality KPIs
- Improved Code Reliability: Monitoring code quality KPIs ensures that the code is tested, bug-free, and stable, which directly translates to more reliable software.
- Faster Time to Market: By reducing defects and code churn, development teams can focus on adding new features and enhancements, speeding up the delivery process.
- Cost Savings: Detecting issues early in the development process prevents costly fixes during later stages, saving time and resources.
- Enhanced Team Collaboration: Code reviews and collaborative practices foster teamwork and knowledge sharing, improving the overall quality of the software.
Opportunities for Improvement in Code Quality
- Increase Test Coverage: Aim for comprehensive unit, integration, and system tests to increase overall coverage and reduce risks associated with untested code.
- Refactor Complex Code: Identify high complexity areas and refactor them to improve maintainability and readability.
- Improve Defect Management: Enhance the defect tracking system to ensure faster identification, classification, and resolution of bugs.
- Increase Code Review Participation: Encourage more team members to participate in code reviews to increase coverage and improve code quality.
Best Practices for Code Quality KPIs
- Set Clear KPI Targets: Define realistic and measurable targets for each KPI, ensuring that your goals are clear and achievable.
- Regularly Monitor KPIs: Make it a practice to track these KPIs regularly, such as monthly or quarterly, to catch issues early and continuously improve code quality.
- Collaborate Across Teams: Encourage collaboration between developers, testers, and managers to ensure KPIs are being tracked effectively and improvement plans are in place.
- Automate Where Possible: Automate testing and reporting to reduce manual intervention and ensure that KPIs are updated in real-time.
Conclusion
A Code Quality KPI Dashboard is an invaluable tool for any development team aiming to produce high-quality software. By tracking KPIs such as test coverage, defect density, and code complexity, teams can identify weaknesses in their codebase and take proactive steps to improve the overall quality.
Frequently Asked Questions (FAQs)
1. Why is Code Quality important for my project?
Code quality ensures that the software is reliable, maintainable, and scalable. It helps reduce defects, minimizes technical debt, and speeds up delivery.
2. How often should I monitor the Code Quality KPIs?
Regular monitoring of KPIs is recommended, ideally on a monthly or quarterly basis, to keep track of performance and address any issues promptly.
3. What is the ideal test coverage percentage?
Ideally, you should aim for a test coverage of 80% or more. However, this varies depending on the type of application and project requirements.
4. Can these KPIs be customized for my team?
Yes, the KPIs can be tailored to your team’s needs. You can adjust the formulas and targets based on the project’s goals and industry standards.
5. How can I reduce code complexity?
Regularly refactor code, simplify logic, and break down large methods into smaller, manageable pieces to reduce cyclomatic complexity.
Visit our YouTube channel to learn step-by-step video tutorials