In today’s data-driven world, businesses are increasingly relying on Key Performance Indicators (KPIs) to measure the performance of their networks. The Network Performance KPI Dashboard is an essential tool to track, analyze, and optimize network performance in real time. It provides a detailed view of the critical network metrics that impact the efficiency and reliability of the network.
This article will delve into the specifics of the Network Performance KPI Dashboard, outlining the key performance indicators (KPIs) used in the dashboard, their significance, and how businesses can effectively leverage this dashboard to monitor network performance.
What is a Network Performance KPI Dashboard?
A Network Performance KPI Dashboard is a powerful visual tool that aggregates and displays various KPIs relevant to network performance. These KPIs are essential for understanding how well a network is operating and identifying areas for improvement. By using this dashboard, organizations can make data-driven decisions to optimize their network performance and troubleshoot issues proactively.
Key Features of the Network Performance KPI Dashboard
Our Network Performance KPI Dashboard is a ready-to-use template designed to help businesses track network performance efficiently. This dashboard consists of 7 essential worksheets, each designed to focus on different aspects of network monitoring:
1. Home Sheet
- Purpose: The Home Sheet serves as an index where users can easily navigate to the other sheets. It includes six buttons that provide quick access to the different sections of the dashboard.

Click to Network Performance KPI
2. Dashboard Sheet Tab
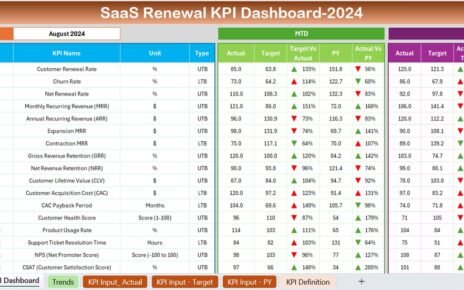
Purpose: This is the main sheet, displaying all KPI information. Users can select the month from a dropdown menu (Range D3) to see the corresponding data. The sheet includes:
- MTD (Month-to-Date) Actual data, Target, Previous Year data.
- YTD (Year-to-Date) Actual data, Target, Previous Year data.
- Target vs Actual and PY vs Actual, with conditional formatting showing up and down arrows to highlight performance trends.

Click to Network Performance KPI
3. KPI Trend Sheet Tab
Purpose: This sheet allows users to select a KPI from a dropdown (Range C3). It displays:
- KPI Group (e.g., Latency, Availability)
- Unit of the KPI (e.g., Percentage, Milliseconds)
- Type of KPI (whether it’s “Lower the better” or “Upper the better”)
- Formula for calculating the KPI and its definition.

Click to Network Performance KPI
4. Actual Numbers Sheet Tab
- Purpose: Users can input the actual numbers for both MTD and YTD. The month can be selected from Range E1.

Click to Network Performance KPI
5. Target Sheet Tab
- Purpose: This sheet allows users to input target values for each KPI for the respective months (MTD and YTD).

Click to Network Performance KPI
6. Previous Year Numbers Sheet Tab
- Purpose: Here, users can input the data for the previous year’s performance for comparison.

Click to Network Performance KPI
7. KPI Definition Sheet Tab
- Purpose: This sheet contains detailed information about each KPI, including the name, group, unit, formula, and definition.

Click to Network Performance KPI
Advantages of Using a Network Performance KPI Dashboard
- Real-Time Insights: The dashboard allows network administrators to monitor network performance in real time, helping them spot issues quickly and efficiently.
- Data-Driven Decision Making: By providing a clear visual representation of KPIs, the dashboard enables data-driven decisions, ensuring network performance is continually optimized.
- Proactive Issue Detection: With historical data and trends, the dashboard helps identify potential issues before they affect network performance.
- Improved Network Optimization: Continuous monitoring allows businesses to fine-tune their network for optimal performance, avoiding bottlenecks and minimizing downtime.
- Performance Comparison: The dashboard enables comparisons of actual performance against targets and previous year data, providing valuable insights into areas that need improvement.
Opportunities for Improvement in Network Performance
While a Network Performance KPI Dashboard provides significant benefits, there are always opportunities for improvement. Here are some suggestions:
- Automating Data Entry: Manual data entry is time-consuming and prone to errors. Integrating automated data collection from network monitoring tools could improve accuracy and save time.
- Advanced Analytics: Adding predictive analytics to forecast network performance trends could help anticipate issues and optimize network design for the future.
- Improving User Interface: A more intuitive and visually appealing user interface would enhance the usability of the dashboard, making it easier for network administrators to interpret data quickly.
Best Practices for Using a Network Performance KPI Dashboard
- Regularly Update Data: Ensure that MTD and YTD data are updated regularly to reflect accurate, real-time network performance.
- Focus on Critical KPIs: While all KPIs are important, focus on the most critical ones (like Uptime, Latency, and Packet Loss) to optimize network performance.
- Leverage Historical Data: Use historical data to identify long-term trends and make informed decisions for future network improvements.
- Set Realistic Targets: Set achievable, realistic targets for each KPI based on industry benchmarks and past performance to ensure continuous progress.
- Use Conditional Formatting: Make use of conditional formatting (e.g., arrows or color coding) to highlight areas that require attention, making it easier to interpret data at a glance.
Frequently Asked Questions (FAQs)
What is a KPI in network performance?
A KPI (Key Performance Indicator) in network performance is a measurable value that demonstrates how effectively a network is functioning. KPIs are used to track network health and identify areas for improvement.
Why is network uptime important?
Network Uptime is a critical KPI because it measures the reliability and availability of the network. Higher uptime means fewer disruptions and better service quality for users.
How do I improve network latency?
To improve network latency, ensure that the network infrastructure is optimized, reduce the number of hops between devices, and upgrade hardware components that contribute to delays.
What should I do if my network is experiencing high packet loss?
High packet loss can be due to issues like network congestion, faulty hardware, or poor signal quality. Troubleshoot by checking network cables, routers, and switches, and ensure adequate bandwidth for your network.
Conclusion
The Network Performance KPI Dashboard is an invaluable tool for businesses that rely on network efficiency. By tracking key metrics such as network uptime, latency, packet loss, and bandwidth utilization, businesses can ensure their networks are performing at their best. The dashboard provides real-time insights, fosters data-driven decision-making, and enables proactive issue detection and optimization. By following best practices and continuously improving the dashboard, businesses can achieve superior network performance and operational efficiency.
Visit our YouTube channel to learn step-by-step video tutorials
View this post on Instagram