Affiliate marketing has emerged as one of the most effective digital marketing strategies. With its performance-based model, it offers flexibility, scalability, and the potential for significant returns. However, like any marketing approach, it’s essential to measure its effectiveness through Key Performance Indicators (KPIs). This is where an Affiliate Marketing KPI Dashboard in Power BI comes into play.
A KPI dashboard is a visual tool that helps businesses track and analyze their key metrics, allowing them to make data-driven decisions. For affiliate marketers, having a Power BI dashboard dedicated to tracking affiliate KPIs can provide crucial insights into campaign performance. This article will guide you through the importance of using an Affiliate Marketing KPI Dashboard, explain its key features, and discuss the benefits, best practices, and opportunities for improvement.
What is an Affiliate Marketing KPI Dashboard in Power BI?
An Affiliate Marketing KPI Dashboard in Power BI is a tool that consolidates all relevant affiliate marketing data into one centralized location. It allows affiliate marketers to track various KPIs, such as sales, conversion rates, clicks, and commissions, and provides a comprehensive overview of the performance of affiliate campaigns.
Power BI is an interactive data visualization tool that integrates seamlessly with various data sources. It allows users to analyze and visualize their data through dynamic and intuitive dashboards. By leveraging Power BI, affiliate marketers can track their KPIs in real-time and make better decisions to improve the performance of their campaigns.
Key Features of the Affiliate Marketing KPI Dashboard in Power BI
The Affiliate Marketing KPI Dashboard template is designed to simplify affiliate marketing tracking and analysis. It consists of three main pages in the Power BI desktop application:
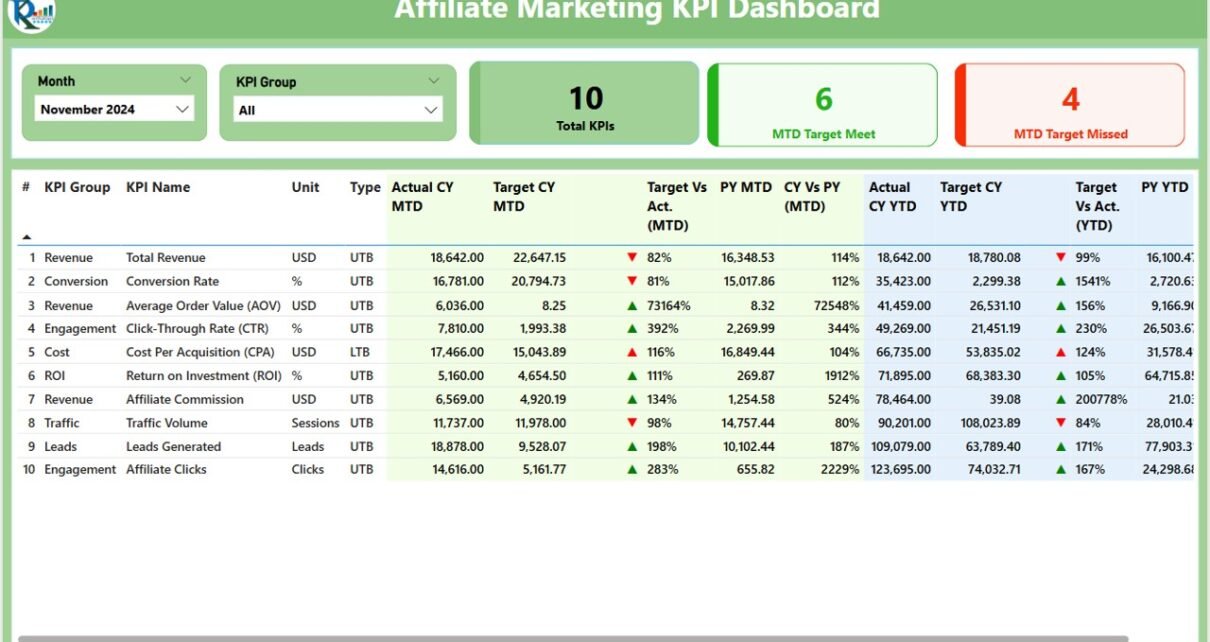
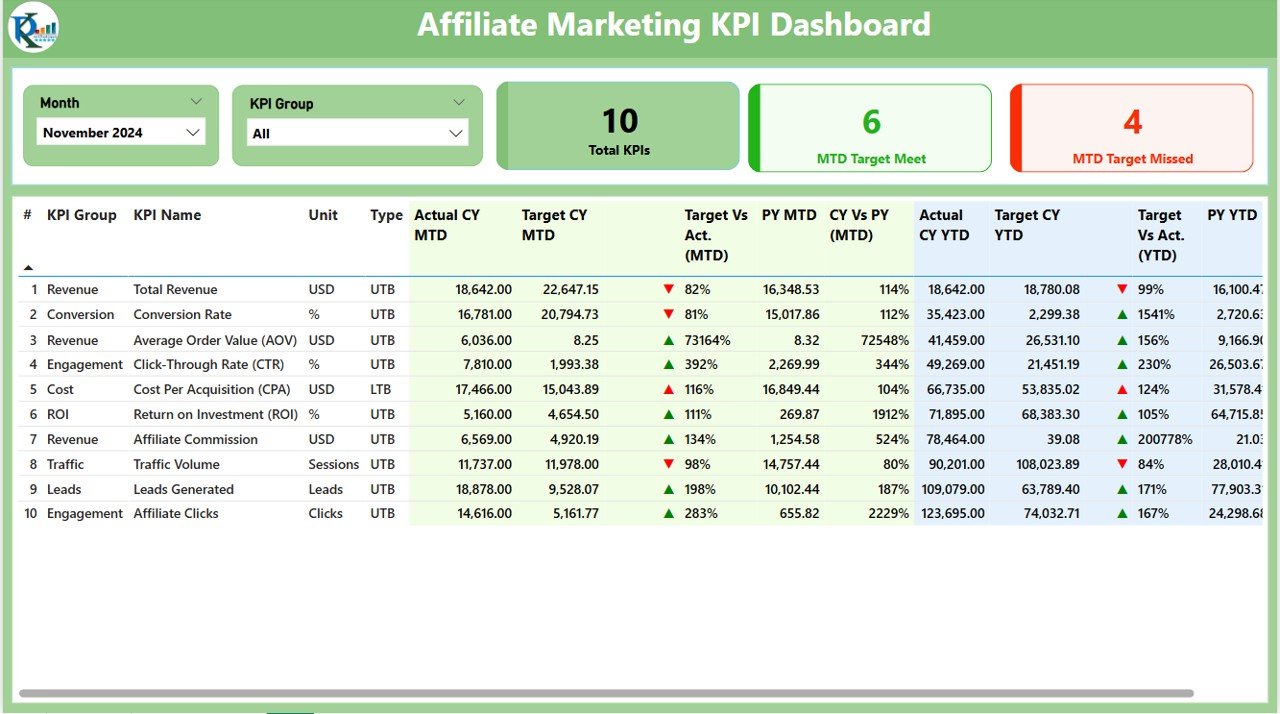
1. Summary Page
This page serves as the main overview of the dashboard. It is where you can get a quick snapshot of your affiliate marketing performance. Below are the key features:
Month and KPI Group Slicer: You can filter the data based on the selected month and KPI group.
KPIs Count: Displays the total number of KPIs being tracked.
MTD Target Meet & Missed Count: Shows how many KPIs have met or missed their Month-to-Date (MTD) targets.
Detailed KPI Table: This table displays the following information for each KPI:
- KPI Number: The sequential number for each KPI.
- KPI Group: The group/category to which the KPI belongs (e.g., conversion rates, clicks).
- KPI Name: The specific name of the KPI.
- Unit: The unit of measurement (e.g., percentage, number of sales).
- Type (LTB/UTB): Specifies whether the KPI is “Lower the Better” (LTB) or “Upper the Better” (UTB).
- Actual CY MTD: The actual value for the current year MTD.
- Target CY MTD: The target value for the current year MTD.
- MTD Icon: A visual indicator (▲ or ▼) to show whether the KPI has met its target.
- Target vs Actual (MTD): The percentage difference between the actual and target values for MTD.
- PY MTD: The MTD value for the previous year.
- CY vs PY (MTD): A percentage comparison between the current MTD and the previous year’s MTD.
- Actual CY YTD: The actual value for the current year’s YTD.
- Target CY YTD: The target value for the current year’s YTD.
- YTD Icon: A visual indicator (▲ or ▼) for YTD performance.
- Target vs Actual (YTD): The percentage difference between the actual and target values for YTD.
- PY YTD: The YTD value for the previous year.
- CY vs PY (YTD): A percentage comparison between the current YTD and the previous year’s YTD.
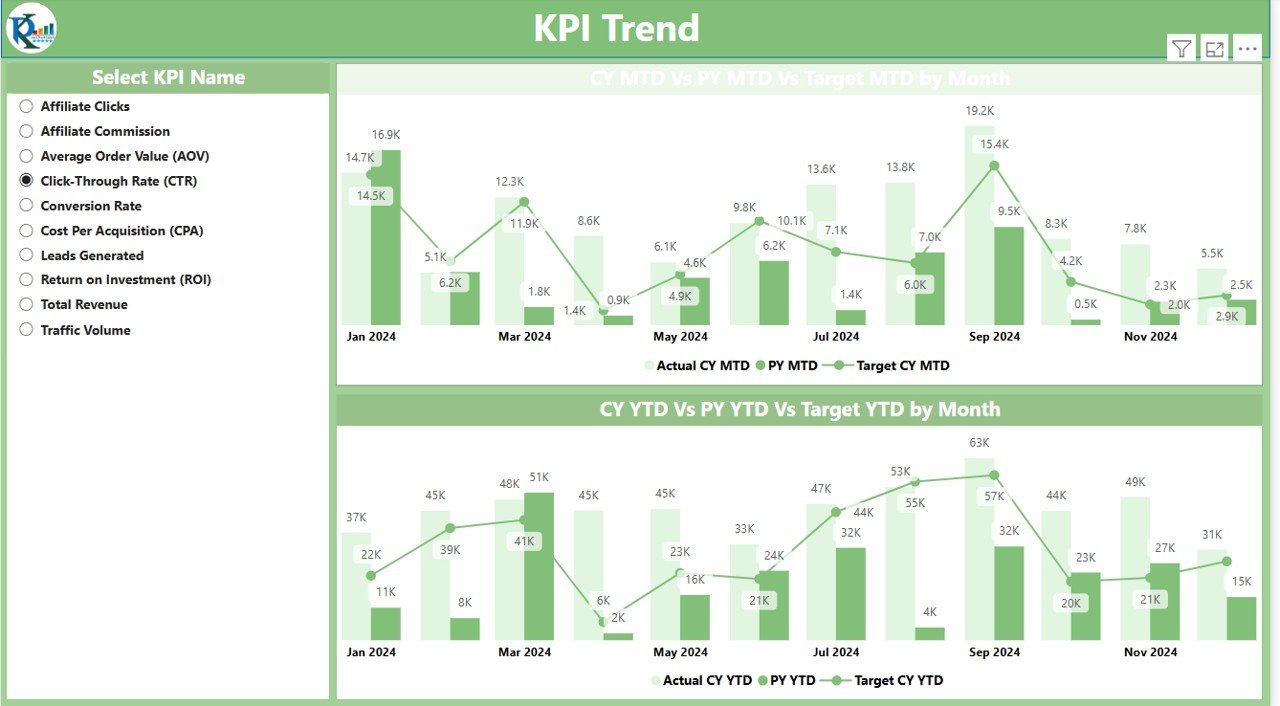
2. KPI Trend Page
This page provides an interactive visualization of the affiliate marketing performance trends. It features two combo charts that allow users to view actual values for the current year, previous year, and targets for both MTD and YTD. A slicer on the left lets users select specific KPIs for analysis.
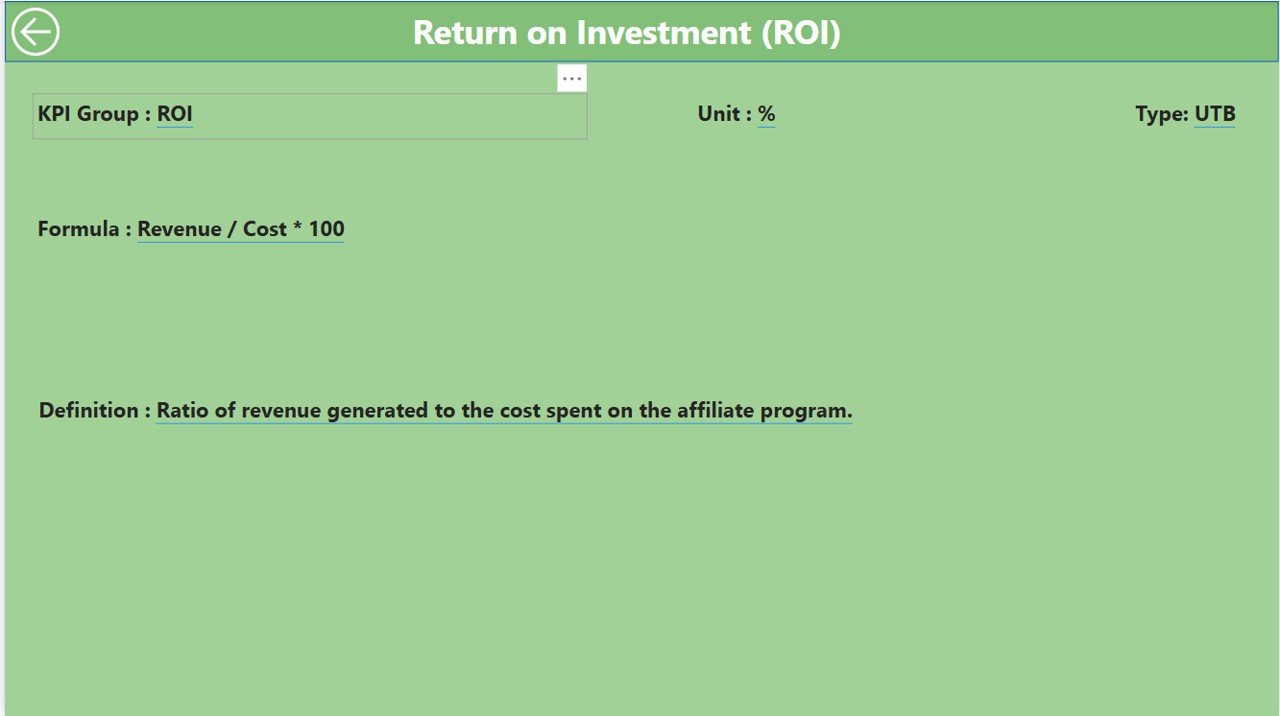
3. KPI Definition Page
This page is a drill-through page, which allows users to see detailed information about each KPI, such as:
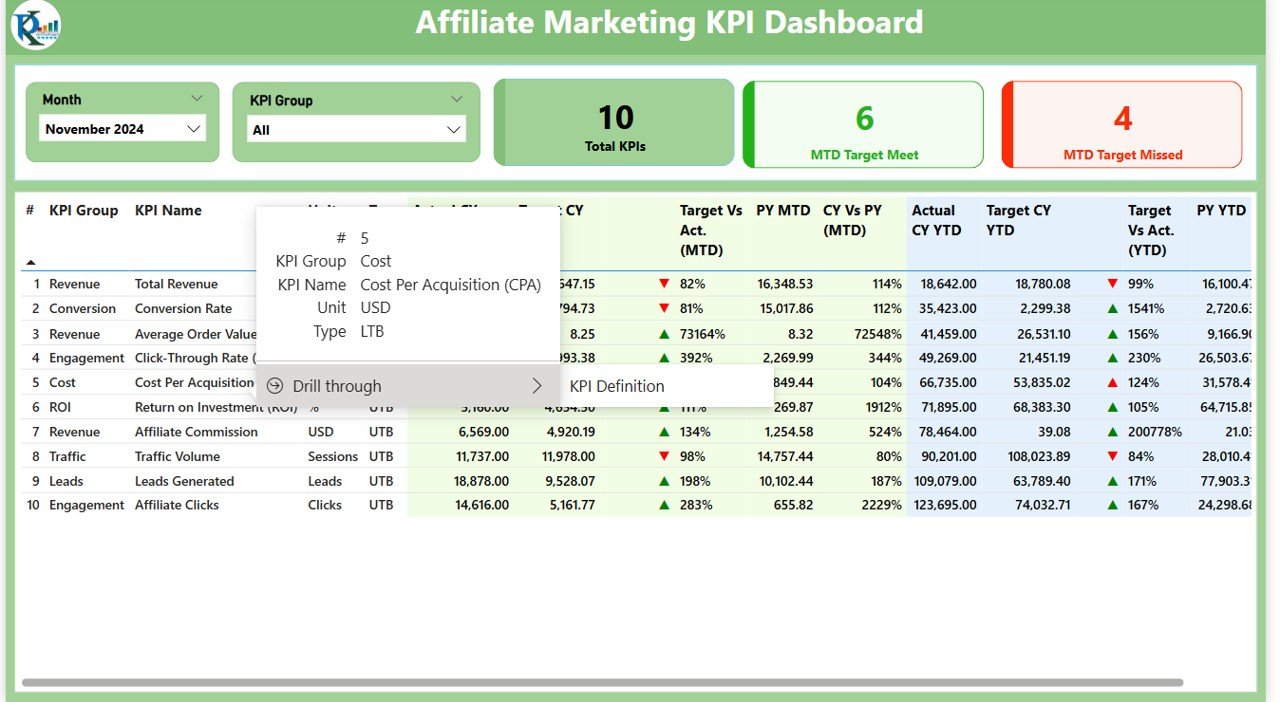
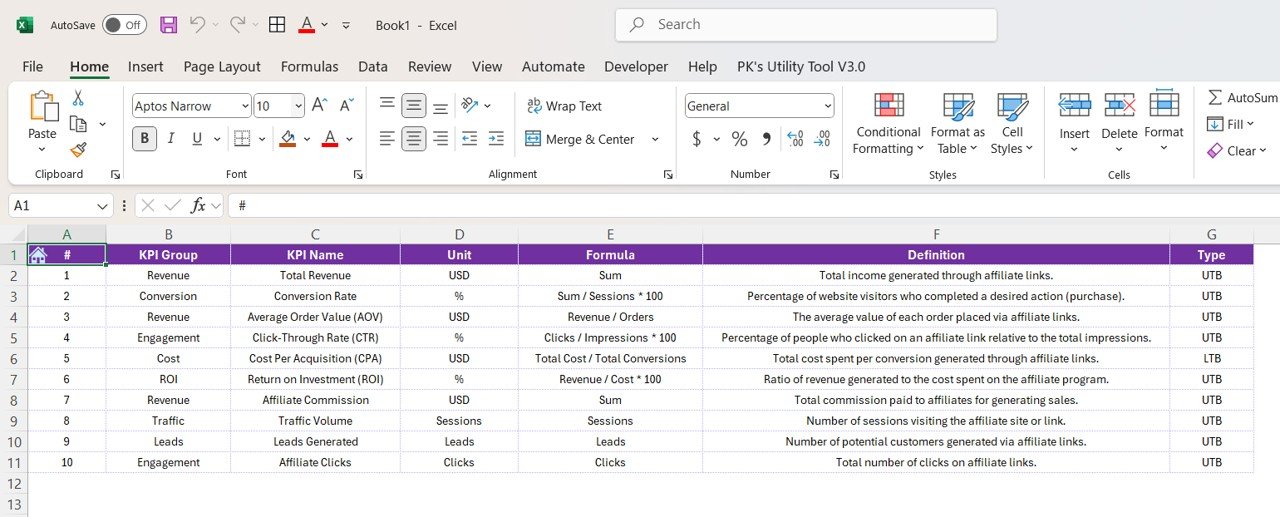
- Formula: The formula used to calculate the KPI.
- KPI Definition: A description of what the KPI represents.
- KPI Group: The category to which the KPI belongs.
- Unit: The unit of measurement for the KPI.
How Does the Dashboard Work with Excel Data?
The Affiliate Marketing KPI Dashboard relies on an Excel file as the data source. Here’s a breakdown of how the Excel file integrates with the Power BI dashboard:
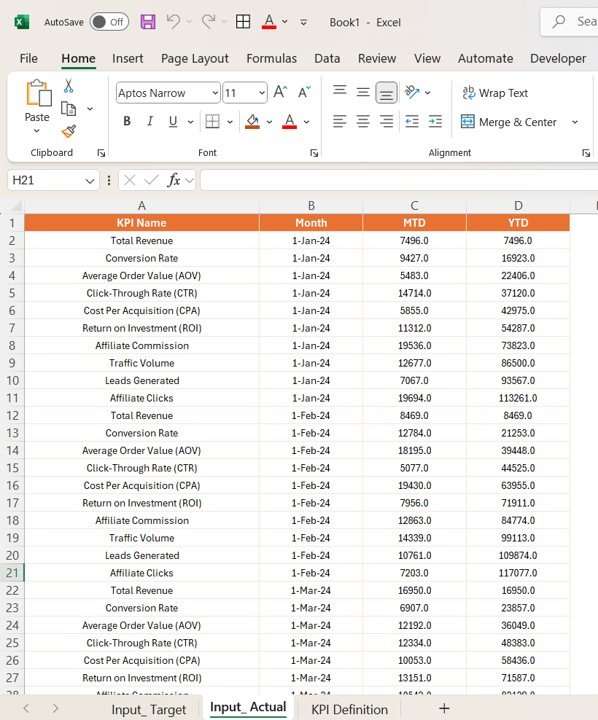
- Input_Actual Sheet Tab
In this tab, users must fill in the actual KPI values for the current year, both MTD and YTD. The data entered in this sheet will automatically populate the Power BI dashboard, providing real-time updates.
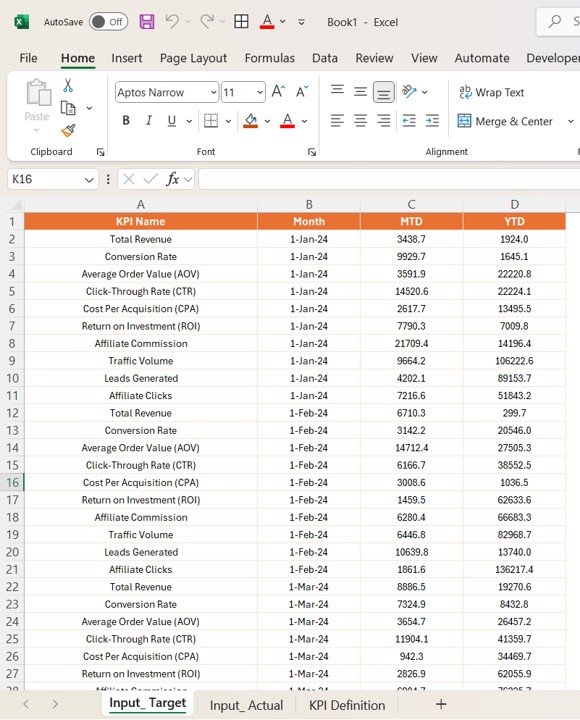
- Input_Target Sheet Tab
This tab is where you enter the target values for each KPI. Similar to the actuals sheet, this data will feed into the dashboard to allow for comparisons between actual and target values.
- KPI Definition Sheet Tab
This sheet captures all the details about each KPI, such as the KPI number, group, name, unit, formula, and type (LTB or UTB). This sheet ensures that all KPIs are clearly defined and their metrics are consistent across the dashboard.
Advantages of Using the Affiliate Marketing KPI Dashboard in Power BI
- Centralized Data Access: By consolidating all KPIs in one dashboard, affiliate marketers can easily access data and track their performance in real time. This centralization ensures that all metrics are monitored and analyzed in a unified way.
- Real-Time Performance Tracking: With Power BI’s real-time data refresh capabilities, affiliate marketers can track performance without delay. This feature enables timely adjustments and decisions, ensuring that campaigns are optimized on-the-fly.
- Data-Driven Decision Making: The Affiliate Marketing KPI Dashboard empowers affiliate marketers to make data-driven decisions. With visualized KPIs and trends, marketers can quickly identify underperforming areas and adjust their strategies accordingly.
- Visual Insights: The dashboard offers clear visual representations of KPIs, making it easier to understand performance metrics at a glance. This reduces the need for manual analysis and makes reporting more efficient.
Opportunities for Improvement in the Affiliate Marketing KPI Dashboard
While the Affiliate Marketing KPI Dashboard is an excellent tool for tracking and optimizing affiliate performance, there are opportunities for further enhancement:
- Automating Data Updates: By integrating the dashboard with affiliate networks and platforms, data updates could be automated, reducing manual input errors and saving time. This would ensure that the dashboard is always up-to-date.
- Advanced Predictive Analytics: Incorporating predictive analytics could help forecast future performance trends based on historical data. This feature would help affiliate marketers anticipate changes and adjust campaigns accordingly.
- Cross-Platform Data Integration: Adding the ability to pull data from multiple platforms (e.g., Google Analytics, affiliate networks, CRM tools) into the dashboard would provide a more holistic view of affiliate performance.
Best Practices for Using the Affiliate Marketing KPI Dashboard in Power BI
To get the most out of the Affiliate Marketing KPI Dashboard, follow these best practices:
- Regularly Update Data: Ensure that the actuals and target values are updated regularly. This will ensure that the data in the dashboard is always current, providing a more accurate picture of performance.
- Prioritize Key KPIs: Focus on the most important KPIs for your affiliate marketing efforts. While the dashboard may display numerous metrics, it’s essential to prioritize the KPIs that directly impact your business goals.
- Use Conditional Formatting: Leverage Power BI’s conditional formatting features to highlight underperforming KPIs. For example, use color-coded icons to quickly spot KPIs that are falling behind or meeting their targets.
- Utilize Slicers for Deep Analysis: Use the slicers in Power BI to drill down into specific data points. By selecting different months, KPI groups, or individual KPIs, you can analyze trends in greater detail and uncover insights that may be missed in an aggregate view.
Frequently Asked Questions (FAQs)
What is the Affiliate Marketing KPI Dashboard in Power BI?
The Affiliate Marketing KPI Dashboard in Power BI is a tool that consolidates key affiliate marketing metrics into one visual dashboard. It helps affiliate marketers track performance, analyze trends, and make data-driven decisions.
How do I update the data in the dashboard?
To update the data, simply input the actual values and target numbers into the Excel file’s Input_ Actual and Input_ Target sheets. The Power BI dashboard will automatically refresh the data.
Can I track both MTD and YTD performance in the dashboard?
Yes, the dashboard allows you to track both Month-to-Date (MTD) and Year-to-Date (YTD) performance for each KPI. This provides a comprehensive view of current and cumulative performance.
How customizable is the dashboard?
The Affiliate Marketing KPI Dashboard in Power BI is highly
Visit our YouTube channel to learn step-by-step video tutorials