Managing and analyzing Key Performance Indicators (KPIs) is crucial for any volunteer program. Tracking performance, volunteer engagement, and efficiency helps organizations optimize their initiatives. This is where a Volunteer Program KPI Dashboard in Excel comes in handy.
In this article, we will discuss how to use the Volunteer Program KPI Dashboard to track essential metrics effectively. We will explore its key features, advantages, and best practices to maximize its impact.
What is a Volunteer Program KPI Dashboard?
A Volunteer Program KPI Dashboard is a structured Excel template that helps non-profits and organizations track various performance metrics. It enables users to monitor volunteer participation, project success, and operational efficiency over time.
This dashboard is designed to provide real-time insights into program performance and allow organizations to make data-driven decisions.
Key Features of the Volunteer Program KPI Dashboard
Our Volunteer Program KPI Dashboard consists of seven essential worksheets:
Home Sheet
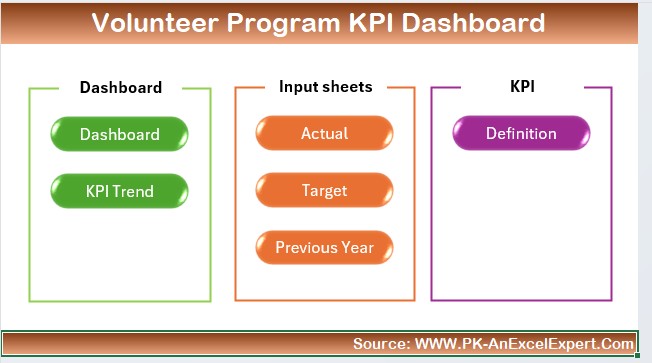
The Home Sheet serves as the index page and navigation hub. It includes six interactive buttons that allow users to jump to different sheets quickly.
Dashboard Sheet Tab
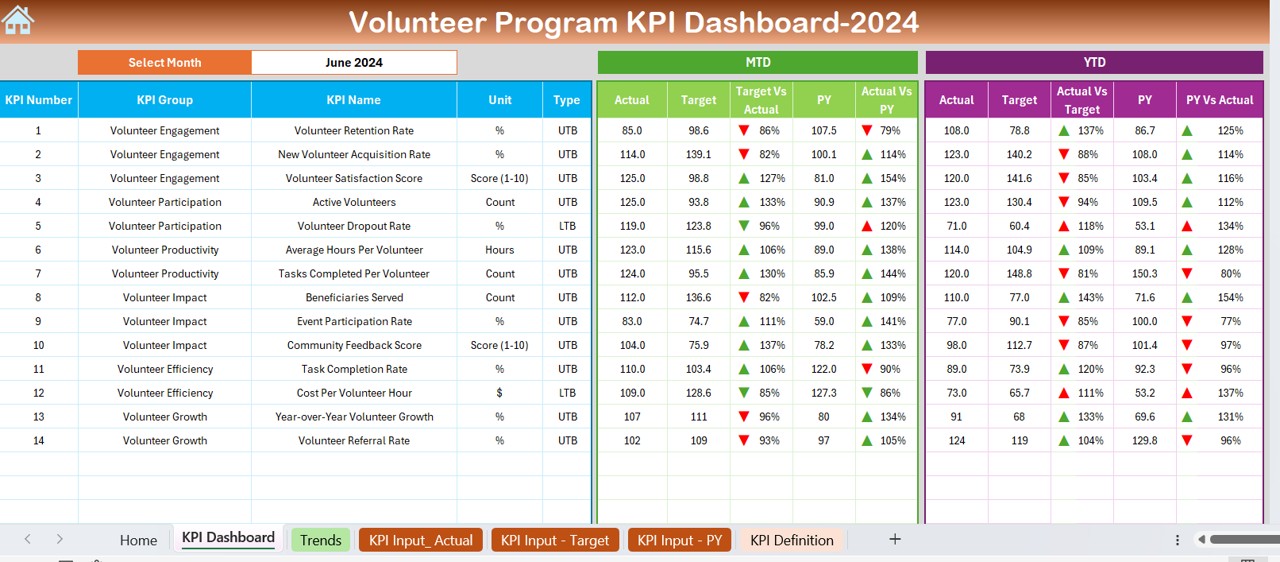
This is the core sheet where all KPIs and performance metrics are displayed. Users can select the month from a drop-down menu in D3, and the dashboard will update dynamically to show:
- MTD (Month-to-Date) and YTD (Year-to-Date) Actuals, Targets, and Previous Year Data
- Target vs Actual Comparisons
- Conditional Formatting Indicators (Up/Down arrows to indicate performance trends)
KPI Trend Sheet Tab
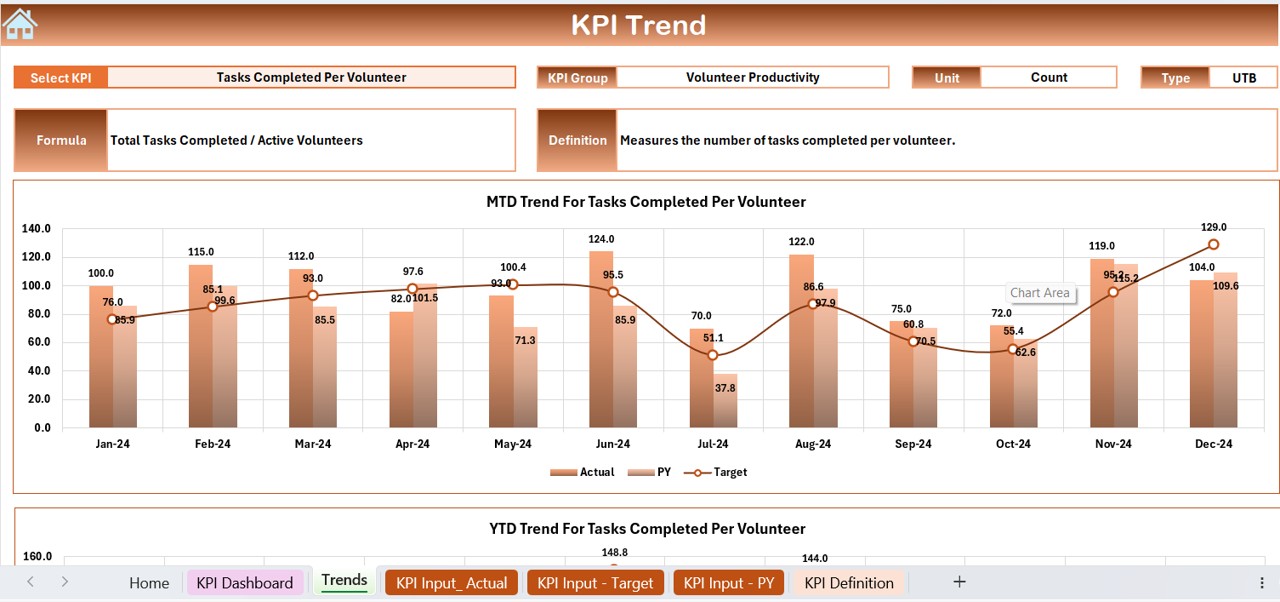
- The KPI Trend Sheet allows users to select a KPI name from a drop-down list in C3. It provides detailed insights, including:
- KPI Group, Unit, Type (Lower is Better or Upper is Better), Formula, and Definition
- MTD and YTD trend charts for Actual, Target, and Previous Year data
Actual Numbers Input Sheet
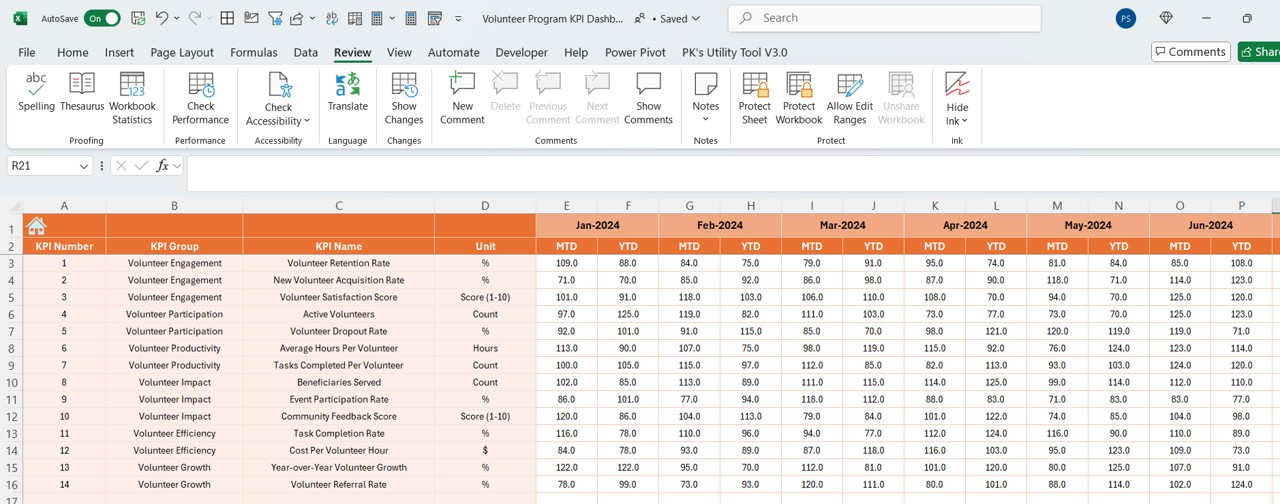
Users manually input the actual performance numbers for MTD and YTD in this sheet. The month selector in E1 allows flexibility to track progress across different months.
Target Sheet Tab
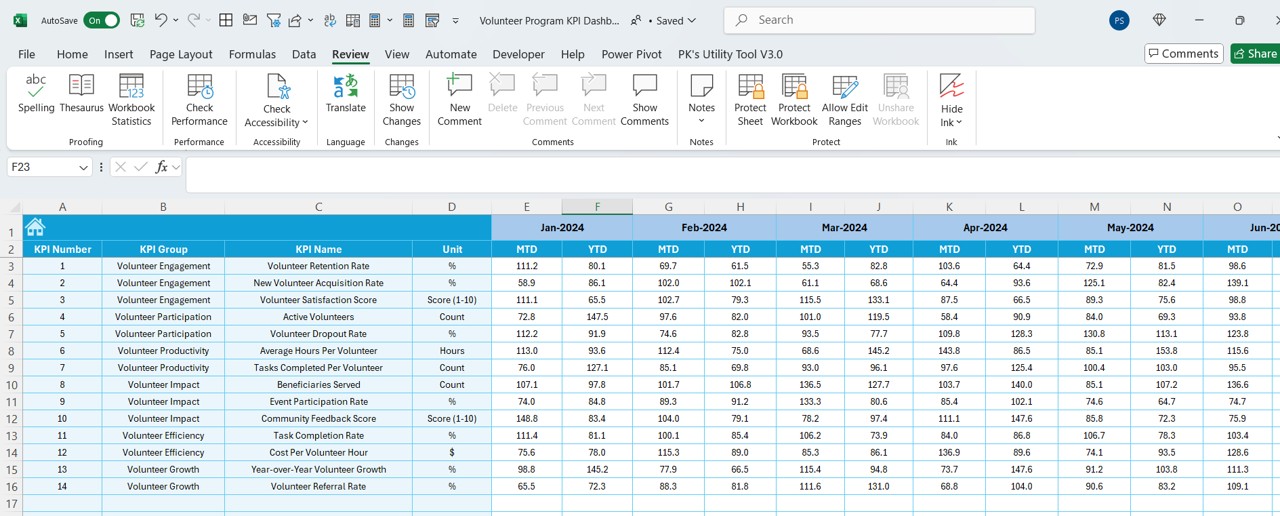
- This sheet is used to set MTD and YTD target values for each KPI. It ensures that performance is measured against predefined goals.
Previous Year Number Sheet Tab
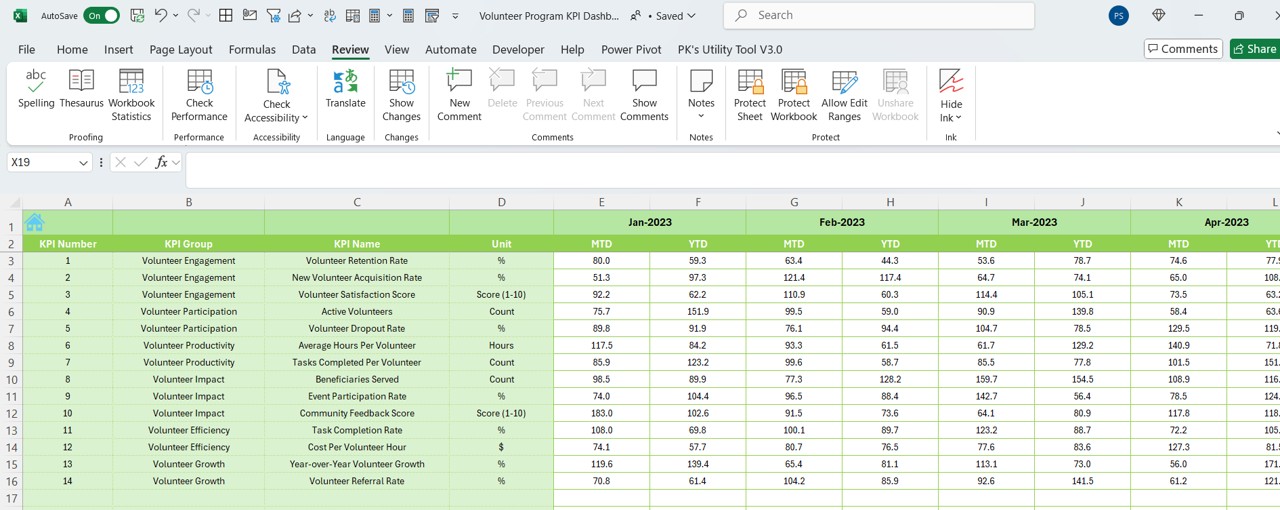
Users enter the previous year’s numbers in this sheet, structured similarly to the Actual Numbers Input Sheet. This allows for year-over-year comparisons.
KPI Definition Sheet Tab
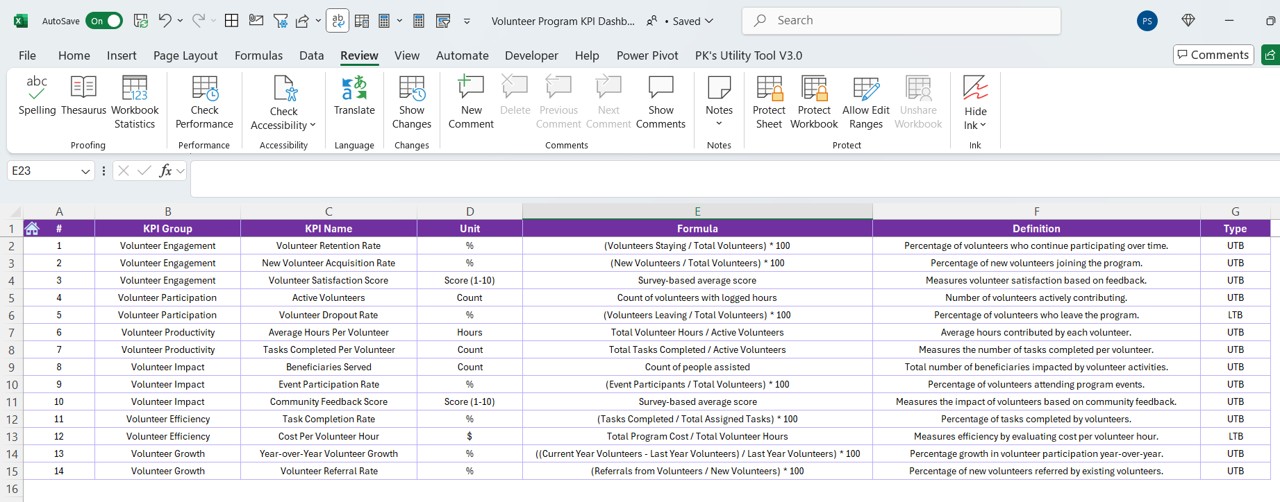
- This sheet serves as a reference guide, containing:
- KPI Name, Group, Unit, Formula, and Definition
- A clear categorization of KPIs, making it easier to interpret data
Advantages of Using a Volunteer Program KPI Dashboard
- Improved Decision-Making: The dashboard enables data-driven decision-making, ensuring that program leaders can make informed adjustments.
- Clear Visualization of Data: With built-in charts, conditional formatting, and structured tables, the dashboard makes data easy to understand.
- Saves Time and Effort: Manual tracking of KPIs can be time-consuming. This automated Excel dashboard streamlines the process.
- Tracks Performance Trends: The KPI Trend Sheet helps organizations monitor performance patterns over time.
- Enhances Accountability: Tracking KPIs ensures that volunteers, coordinators, and stakeholders stay accountable for their roles.
- Year-over-Year Comparisons: With previous year data available, organizations can assess growth and identify areas for improvement.
Best Practices for Using the Volunteer KPI Dashboard
Define Clear KPIs
- Ensure that KPIs align with organizational goals. Common KPIs include:
- Volunteer Retention Rate
- Hours Served Per Volunteer
- Event Attendance Rate
- Fundraising Efficiency
- Project Completion Rate
Regularly Update Data
For accurate analysis, update the Actual Numbers Input Sheet consistently.
Leverage Data Visualization
Make use of the trend charts and conditional formatting indicators to identify key performance trends.
Set Achievable Targets
Use the Target Sheet to set realistic and actionable goals.
Conduct Periodic Reviews
Evaluate KPIs monthly or quarterly to make necessary program adjustments.
Conclusion
A Volunteer Program KPI Dashboard in Excel is a powerful tool that simplifies tracking and analyzing volunteer performance. By leveraging structured data, automation, and visualization tools, organizations can ensure better engagement, efficiency, and overall success in their volunteer programs.
Frequently Asked Questions (FAQs)
What is the purpose of a Volunteer KPI Dashboard?
A Volunteer KPI Dashboard helps organizations monitor, measure, and analyze key performance metrics related to volunteer programs.
Can I customize this Excel Dashboard for my organization?
Yes! The dashboard is fully customizable—you can modify KPIs, targets, and visual elements to align with your specific needs.
How often should I update the dashboard?
It is recommended to update the dashboard monthly to keep track of MTD and YTD progress effectively.
Do I need advanced Excel skills to use this dashboard?
No! This dashboard is user-friendly, and basic Excel knowledge is enough to navigate and update data.
Can I use this for multiple volunteer programs?
Absolutely! You can track multiple programs by modifying KPI categories or using separate sheets for different projects.
Visit our YouTube channel to learn step-by-step video tutorials
View this post on Instagram