Tracking and optimizing lead nurturing efforts is essential for businesses aiming to improve their conversion rates. A Lead Nurturing KPI Dashboard in Excel helps marketers and sales teams analyze performance, set targets, and track progress effectively. In this article, we will explore the features, benefits, and best practices of using a Lead Nurturing KPI Dashboard in Excel.
What is a Lead Nurturing KPI Dashboard?
A Lead Nurturing KPI Dashboard is a data-driven tool that allows businesses to track key performance indicators (KPIs) related to lead management, follow-ups, and conversions. By using an Excel-based dashboard, users can easily analyze data, identify trends, and make data-backed decisions to optimize their lead nurturing strategies.
Key Features of the Lead Nurturing KPI Dashboard
Our Lead Nurturing KPI Dashboard is a ready-to-use template that includes multiple interactive features to simplify KPI tracking. Below are its key components:
Home Sheet
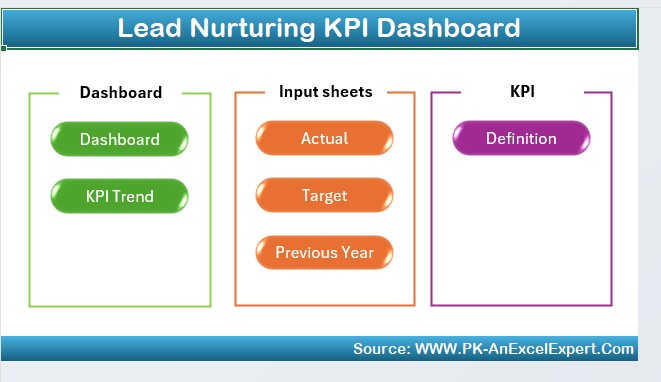
- The Home Sheet serves as an index page.
- It includes six navigation buttons to help users jump to the respective sheets effortlessly.
Dashboard Sheet Tab

- The Dashboard Sheet is the main tab where all KPI-related data is displayed.
- Users can select the Month from the dropdown (Range D3), and all values update dynamically.
The dashboard presents:
- MTD Actual, Target, Previous Year Data, and comparisons.
- YTD Actual, Target, Previous Year Data, and comparisons.
- Conditional formatting with up/down arrows for easy visualization of trends.
KPI Trend Sheet Tab
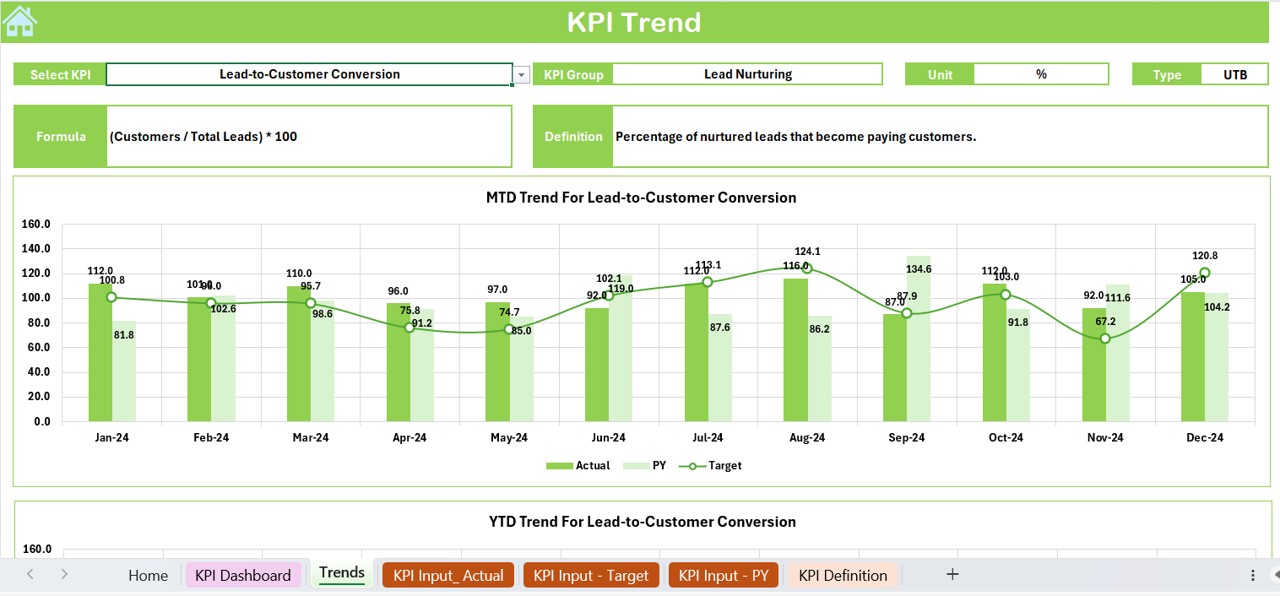
- This tab allows users to track KPI performance over time.
- Users can select a KPI from the dropdown (Range C3) and view:
- KPI Group
- KPI Unit
- KPI Type (Lower is Better or Upper is Better)
- KPI Formula
- KPI Definition
The tab includes MTD and YTD trend charts displaying Actual, Target, and PY numbers.
Actual Numbers Input Sheet
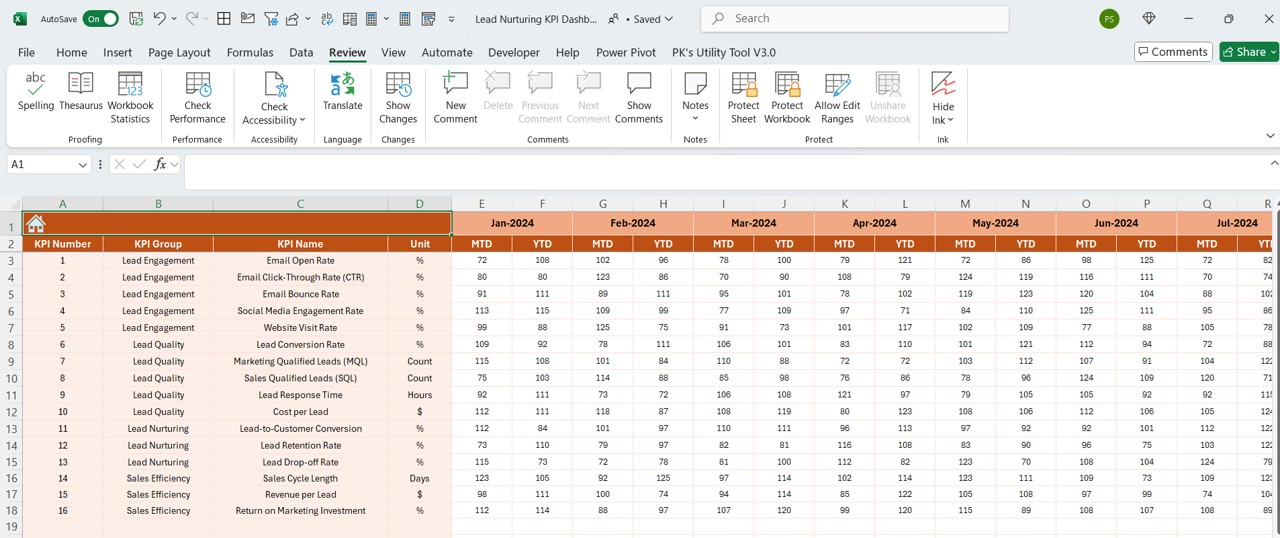
- This is where users enter actual MTD and YTD values for each KPI.
- The month can be changed in Range E1, updating the entire dataset accordingly.
Target Sheet Tab
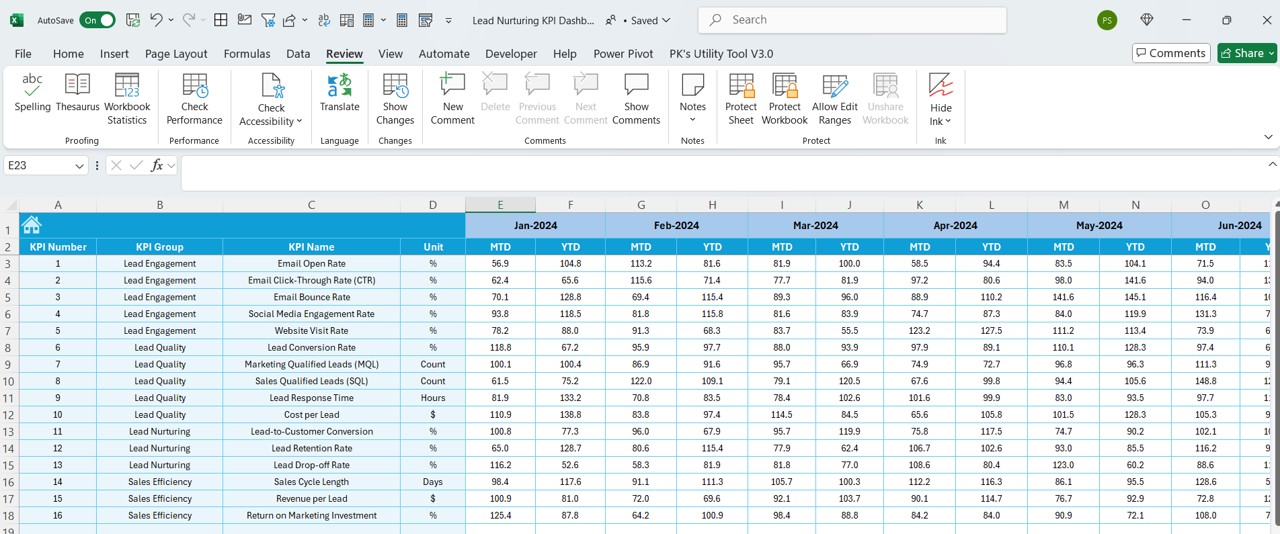
- Users can input Target values for each KPI on a monthly and yearly basis.
- These values are automatically reflected in the Dashboard Sheet and Trend Sheet.
Previous Year Number Sheet Tab
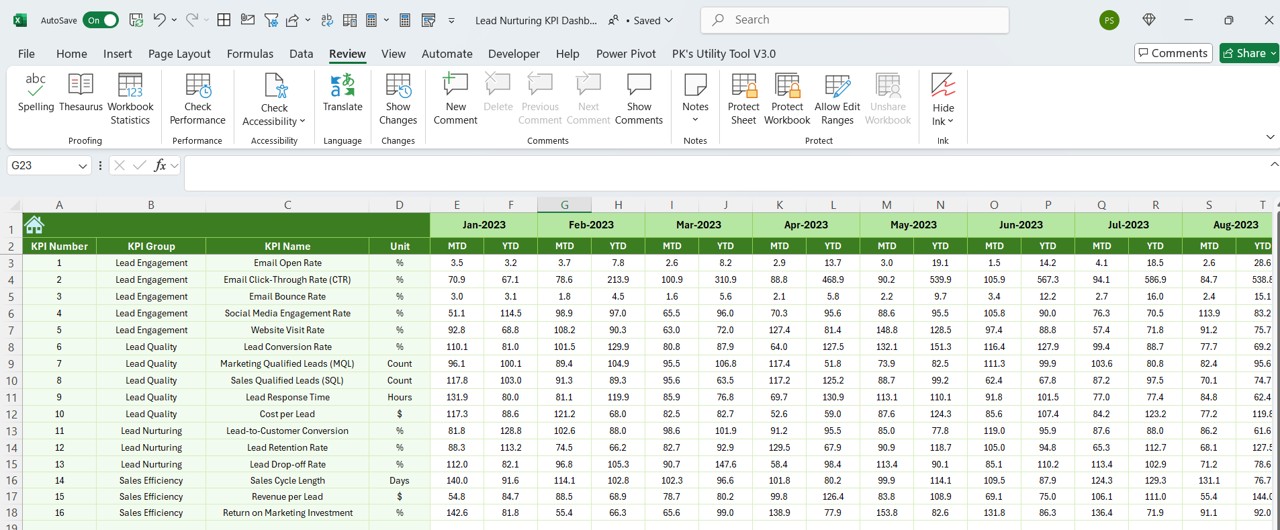
- This sheet stores previous year’s KPI data for comparison.
- The format is the same as the Actual Numbers Input Sheet.
KPI Definition Sheet Tab
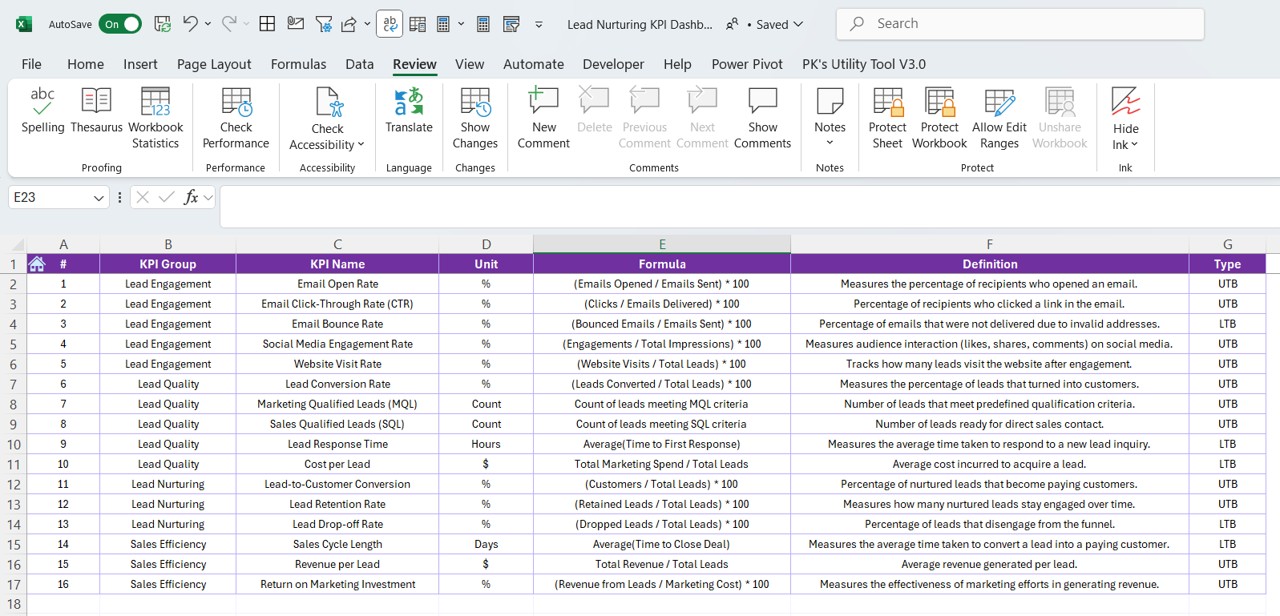
- Users enter the KPI Name, Group, Unit, Formula, and Definition in this tab.
- This ensures a standardized approach for measuring and tracking KPIs.
Advantages of Using a Lead Nurturing KPI Dashboard in Excel
- Improved Decision Making: Gain real-time insights into lead nurturing performance.
- Automated Tracking: The dashboard updates dynamically with new data inputs.
- Customization Flexibility: Modify and adapt KPIs based on business needs.
- Time Efficiency: Eliminates manual calculations and data organization.
- Performance Comparisons: View MTD vs. YTD vs. Previous Year data in a single interface.
Best Practices for Using the Lead Nurturing KPI Dashboard
- Define Clear KPI Goals: Set realistic and measurable lead nurturing targets based on historical data and business objectives.
- Ensure Data Accuracy: Regularly update actual numbers, targets, and previous year data to maintain dashboard accuracy.
- Monitor Trends and Adjust Strategies: Use the KPI Trend Sheet to identify patterns and adjust your marketing strategies accordingly.
- Use Conditional Formatting for Visual Impact: Highlight key trends with color-coded indicators (e.g., green for positive growth, red for decline).
- Regularly Review and Optimize KPIs: KPIs should evolve based on market trends and business goals—keep refining them periodically.
Conclusion
A Lead Nurturing KPI Dashboard in Excel is a powerful tool for tracking, analyzing, and improving lead management processes. By using this dashboard, businesses can identify performance gaps, optimize marketing efforts, and enhance conversion rates. Regular updates and data-driven strategies will ensure continued success in lead nurturing.
Frequently Asked Questions (FAQs)
What are the essential KPIs for lead nurturing?
- Conversion Rate
- Lead Response Time
- Email Engagement Rate
- Lead Score Progression
- Cost Per Lead
How can I update the data in the Lead Nurturing KPI Dashboard?
- Enter actual numbers in the Actual Numbers Input Sheet.
- Update targets in the Target Sheet.
- Input previous year data in the Previous Year Number Sheet.
Can I customize the Lead Nurturing KPI Dashboard?
Yes! You can add or modify KPIs, update formulas, and change the dashboard layout to match your business needs.
How does this dashboard help in decision-making?
The dashboard provides real-time insights, performance comparisons, and trend analysis, helping businesses make informed decisions.
Is Excel the best tool for tracking lead nurturing KPIs?
Excel is an affordable and flexible solution for tracking KPIs. However, businesses with complex needs may consider Power BI, Google Data Studio, or CRM software for more advanced analytics.
Visit our YouTube channel to learn step-by-step video tutorials
View this post on Instagram