In the world of data-driven decision-making, Key Performance Indicators (KPIs) play a crucial role in measuring success and guiding business strategies. A Knowledge Base KPI Dashboard is a powerful tool that allows businesses to monitor and evaluate their performance using well-defined KPIs. Whether you’re in customer support, IT, or any other industry that relies on a knowledge base, having an effective KPI dashboard can transform your approach to operations. In this article, we will explore everything you need to know about Knowledge Base KPI Dashboards, including the essential KPIs, how to use them, and best practices for success.
Key Features of the Knowledge Base KPI Dashboard
Here are the key features of the Knowledge Base KPI Dashboard:
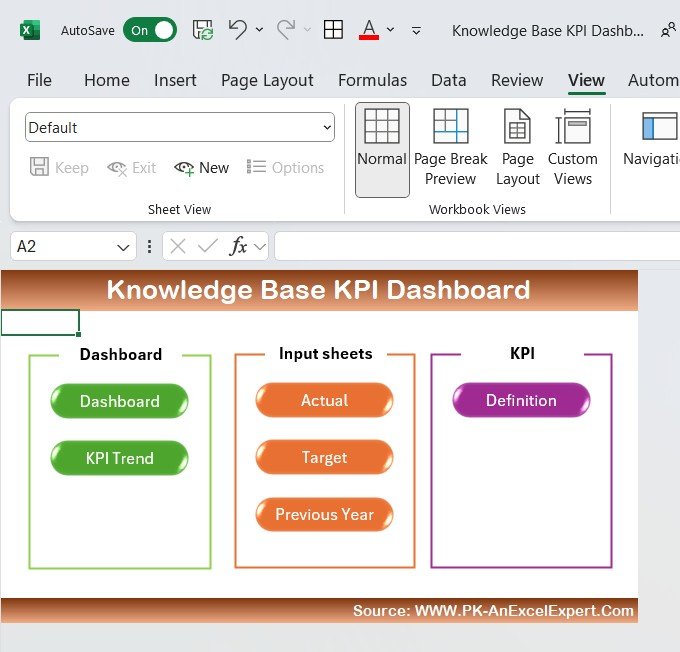
1. Home Sheet
The Home Sheet serves as the index page. It includes buttons to navigate easily to other sheets. This organized layout makes it easy to manage and access the dashboard’s various sections.
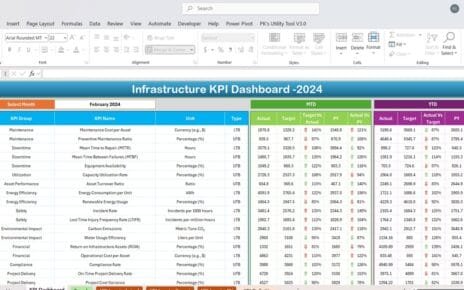
2. Dashboard Sheet Tab
This is the main sheet of the dashboard, where all KPI data is displayed. The dashboard features:
- MTD (Month-to-Date) Actual: The actual values for the selected month.
- Target: The expected value for the selected month.
- Previous Year Data: A comparison of the previous year’s data.
- Target vs Actual: A side-by-side comparison of the actual value against the target for the selected month.
- YTD (Year-to-Date) Actual: The actual data accumulated from the beginning of the year to the selected month.
Conditional formatting is used to show up/down arrows for easy visualization of whether the KPI is performing as expected.

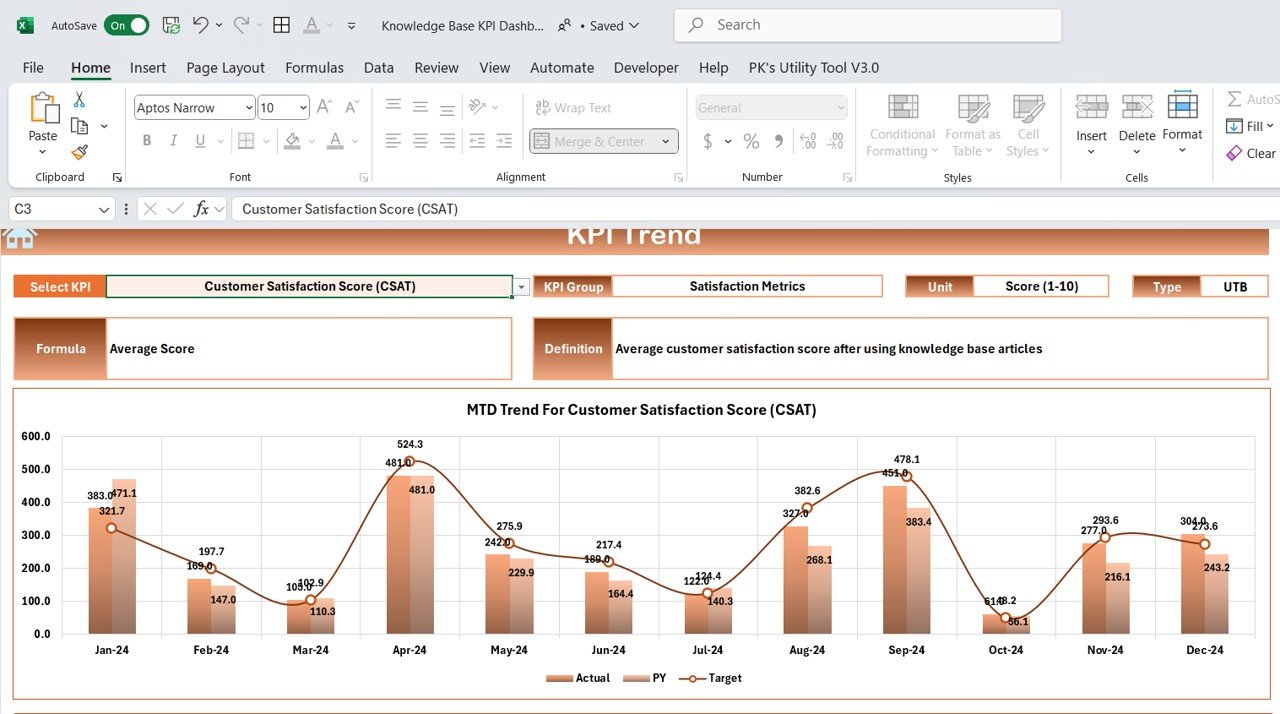
3. KPI Trend Sheet Tab
This sheet allows users to select a specific KPI and analyze its trend over time. The following information is available:
- KPI Group: The category the KPI falls under.
- Unit: The measurement unit of the KPI.
- Type of KPI: Whether it’s “Lower the Better” or “Upper the Better.”
- Formula: The mathematical formula to calculate the KPI.
- Definition: The clear description of what the KPI represents.
4. Actual Numbers Sheet Tab
This sheet lets you enter the actual number for each KPI on both a monthly and yearly basis. The data is automatically updated based on the selected month, making it easy to track the progress of KPIs throughout the year.
5. Target Sheet Tab
This tab is where you enter the target numbers for each KPI on a monthly and yearly basis. This allows you to track progress against predefined targets and evaluate whether you’re meeting your goals.
6. Previous Year Numbers Sheet Tab
For comparison, this sheet allows you to enter the previous year’s data for each KPI. This historical data is essential for trend analysis and identifying areas for improvement.
7. KPI Definition Sheet Tab
This sheet allows you to document each KPI’s: