In the fast-paced world of web development, tracking performance is essential. A Web Development KPI Dashboard in Excel helps businesses and teams monitor key performance indicators (KPIs) to measure success, optimize performance, and make data-driven decisions.
This article will explore how to create, use, and optimize a Web Development KPI Dashboard in Excel. We will cover its features, advantages, best practices, and frequently asked questions to ensure you get the most out of your dashboard.
What is a Web Development KPI Dashboard?
A Web Development KPI Dashboard is a centralized tool designed to track essential Key Performance Indicators (KPIs) in web development projects. It provides insights into project timelines, performance trends, user engagement, and more.
Using Excel, you can create an interactive dashboard that visually presents these KPIs, making it easier to analyze performance over time. The dashboard includes MTD (Month-to-Date) and YTD (Year-to-Date) statistics, trend charts, and target comparisons.
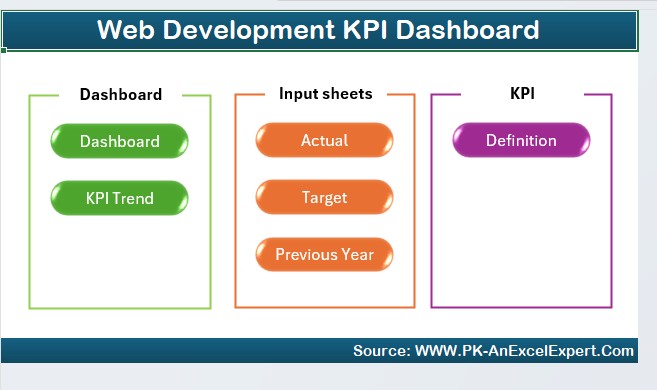
Key Features of the Web Development KPI Dashboard
This Excel dashboard consists of seven worksheets, each serving a specific purpose:
Home Sheet
- This is the index page that provides quick navigation.
- Contains six buttons that allow users to jump to specific sections of the dashboard.
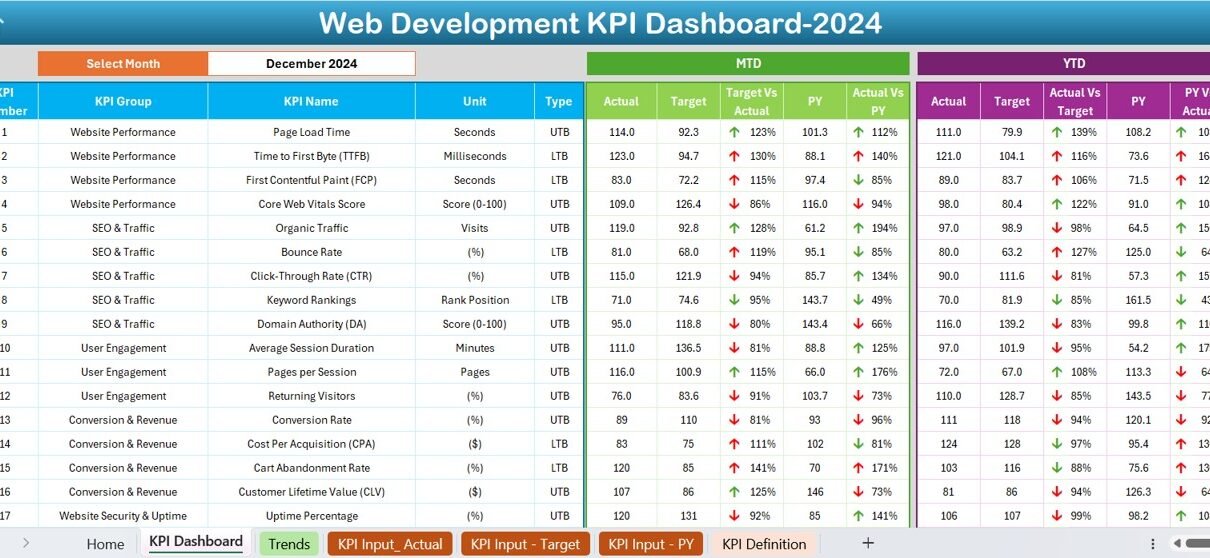
Dashboard Sheet Tab
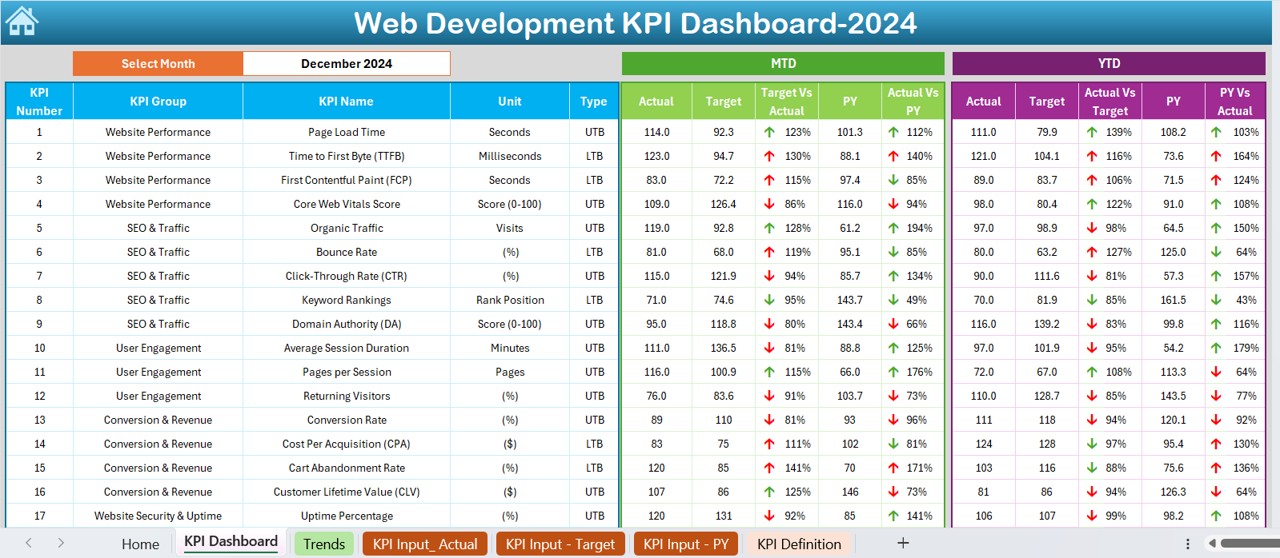
The main dashboard displaying all KPIs.
- A drop-down menu (D3) lets users select the month, updating all dashboard numbers accordingly.
- Displays MTD and YTD Actual vs. Target vs. Previous Year (PY) values.
- Uses conditional formatting to indicate performance trends with up/down arrows.
KPI Trend Sheet Tab
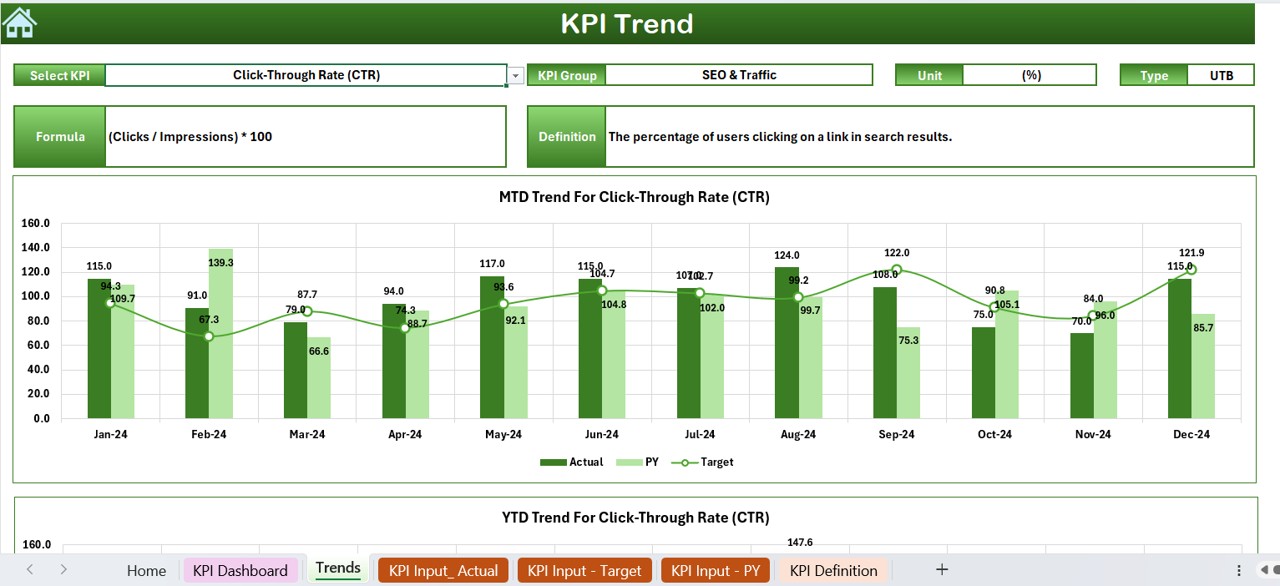
- Allows selection of a specific KPI (C3 drop-down).
- Displays KPI Group, Unit, Type (Lower/Upper is better), Formula, and Definition.
- Shows MTD and YTD trend charts for Actual, Target, and PY values.
Actual Numbers Input Sheet
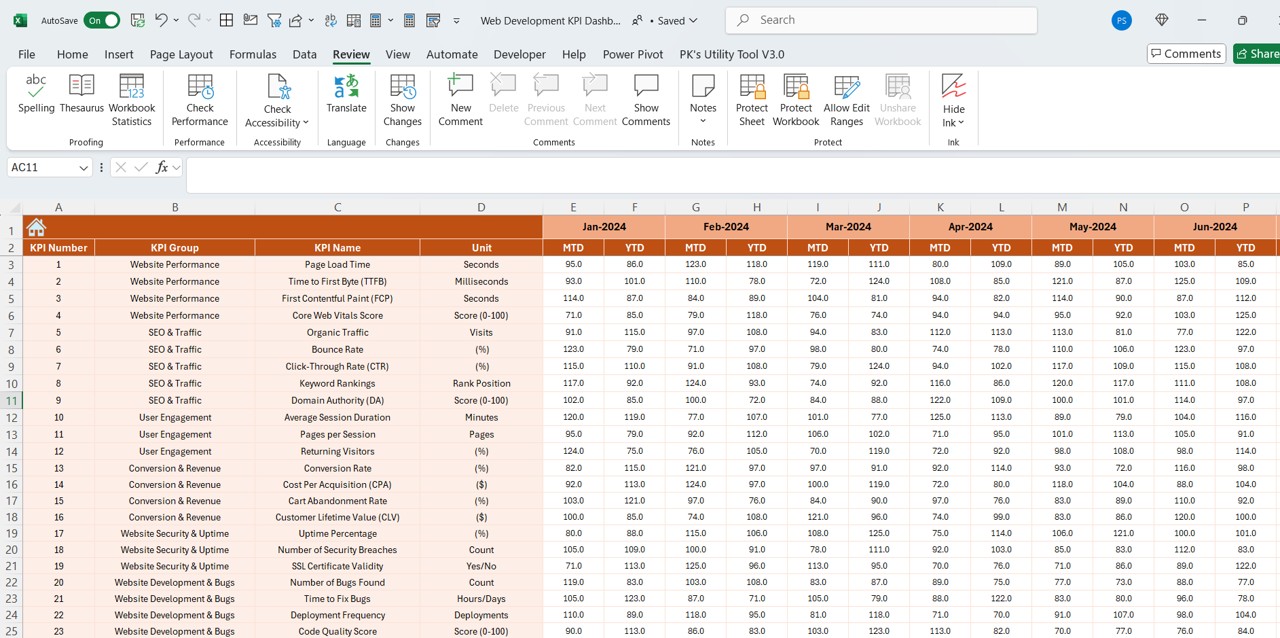
- Users input actual KPI values for MTD and YTD.
- The E1 cell allows users to set the starting month of the year.
Target Sheet Tab
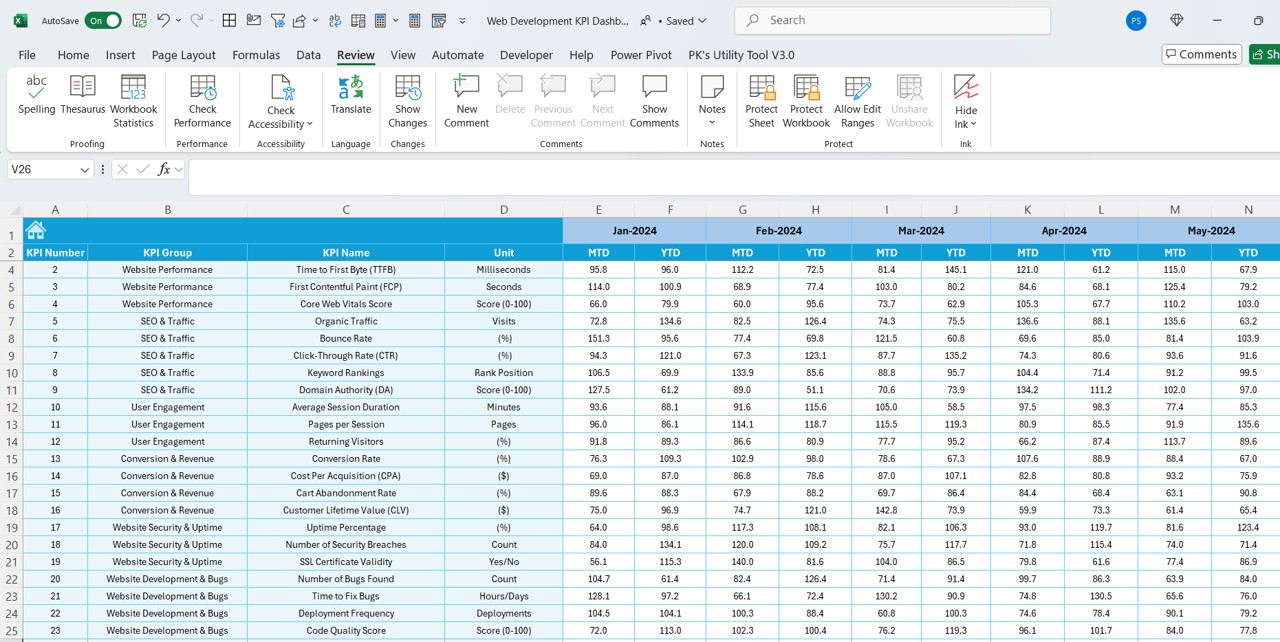
- Users enter monthly target values for MTD and YTD for each KPI.
Previous Year Numbers Sheet Tab
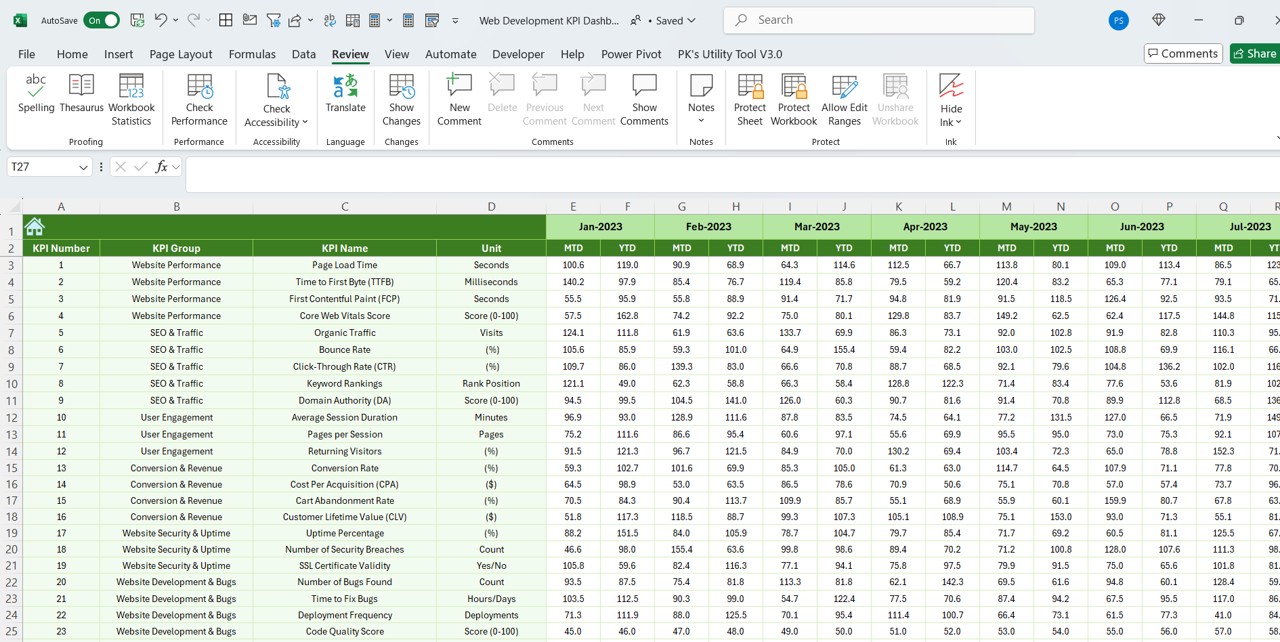
- Users input last year’s KPI values, structured similarly to the current year.
KPI Definition Sheet Tab
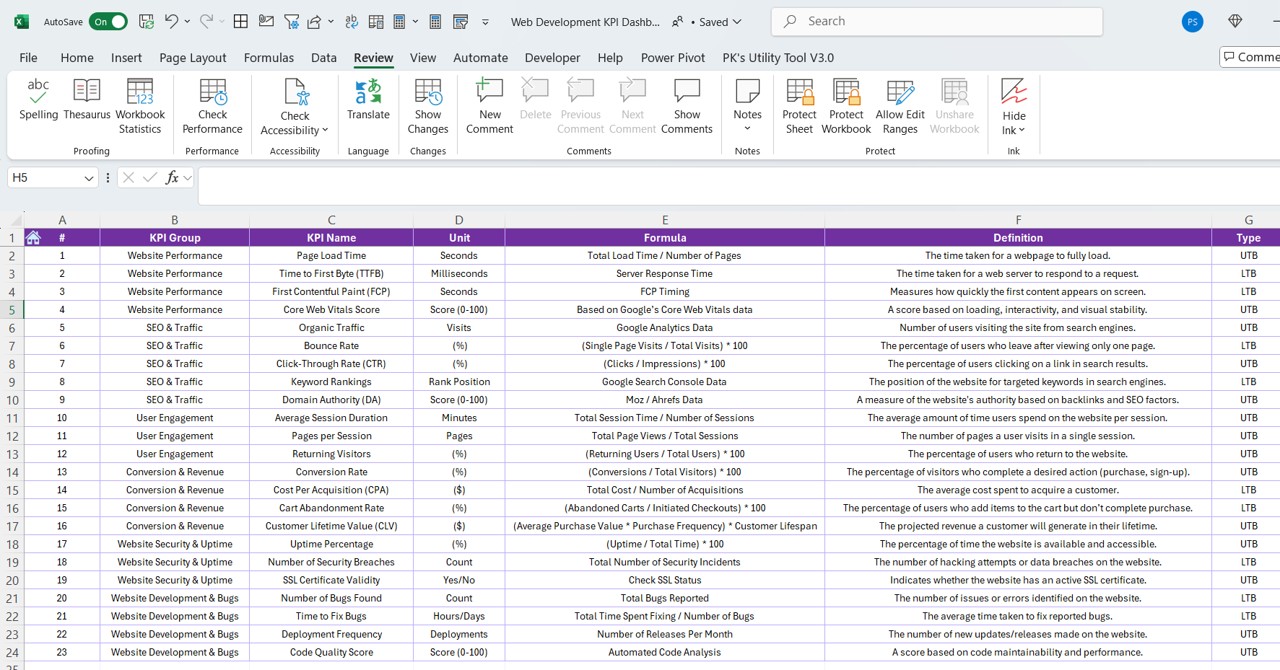
- Stores KPI names, groups, units, formulas, and definitions for reference.
Advantages of Using a Web Development KPI Dashboard
- Data-Driven Decision Making: Having real-time access to KPI trends allows teams to analyze performance and make informed decisions.
- Time Efficiency: Automated calculations and drop-down selections save time compared to manual tracking.
- Performance Tracking: The dashboard visually represents KPI trends, helping identify areas for improvement.
- Customization Flexibility: Users can modify formulas, add new KPIs, and personalize visual elements.
- Easy Reporting: Instead of generating multiple reports, the dashboard provides all critical insights in one place.
Best Practices for Using the Web Development KPI Dashboard
Define Clear KPIs
- Ensure that your selected KPIs align with your web development goals. Common KPIs include:
- Website Load Time
- Page Views
- Conversion Rate
- Bug Resolution Time
Update Data Regularly
- Enter actual numbers consistently in the Actual Numbers Input Sheet.
- Keep Target and Previous Year data up-to-date for accurate analysis.
Use Conditional Formatting Effectively
- Utilize color-coded indicators (green for positive trends, red for negative trends) to visualize performance instantly.
Ensure Data Accuracy
- Double-check calculations and formulas to prevent reporting errors.
- Use data validation to restrict incorrect data entry.
Leverage Trend Analysis
- Use the KPI Trend Sheet to identify long-term patterns.
- Adjust strategies based on data-driven insights.
- Frequently Asked Questions (FAQs)
What Are the Most Important Web Development KPIs?
Some essential web development KPIs include:
- Page Load Speed – Measures how quickly a website loads.
- Bounce Rate – Indicates the percentage of visitors who leave without interacting.
- SEO Performance – Tracks search engine rankings and organic traffic.
- Bug Fix Time – Measures how long it takes to resolve reported issues.
Can I Customize This KPI Dashboard?
- Yes! The Excel dashboard is fully customizable. You can:
- Add new KPIs based on your needs.
- Modify formulas to match specific calculation methods.
- Change the visual design to suit your preferences.
How Often Should I Update the Dashboard?
- It depends on the nature of your projects. However:
- Daily or Weekly updates work best for fast-moving projects.
- Monthly updates are ideal for long-term trend analysis.
Do I Need Advanced Excel Skills to Use This Dashboard?
- No! The dashboard is user-friendly, and even basic Excel users can navigate it. However, knowledge of:
- Pivot Tables
- Conditional Formatting
- Data Validation
- can enhance usability.
Can I Use This Dashboard for Other Industries?
- Yes! While designed for web development, you can modify KPIs to suit other industries such as:
- Marketing (e.g., Social Media Engagement, CTR)
- Sales (e.g., Revenue, Lead Conversion Rates)
- Customer Service (e.g., Response Time, Resolution Rate)
Conclusion
A Web Development KPI Dashboard in Excel is an essential tool for tracking project performance and making data-driven decisions. With features like MTD and YTD tracking, KPI trend analysis, and customizable reports, it simplifies web development analytics.
Visit our YouTube channel to learn step-by-step video tutorials
View this post on Instagram


