Customer churn is one of the most critical metrics for businesses today. A high churn rate can indicate poor customer satisfaction, ineffective services, or even product flaws. Tracking this metric, along with others, allows businesses to take proactive steps in retaining customers. In this article, we’ll explore how you can create a Customer Churn KPI Dashboard, listing all the essential KPIs, their definitions, units, and formulas, along with best practices, advantages, and opportunities for improvement.
Table of Contents
ToggleWhat is a Customer Churn KPI Dashboard?
A Customer Churn KPI Dashboard is a powerful tool that allows businesses to monitor and visualize their customer churn rate and other related KPIs. This dashboard helps in analyzing customer behavior, pinpointing potential issues, and identifying trends that affect customer retention. By tracking key performance indicators (KPIs), businesses can easily monitor their progress towards improving customer satisfaction and retention.
Key Features of the Customer Churn KPI Dashboard
In this Customer Churn KPI Dashboard template, we provide a ready-to-use solution specifically designed to track customer churn and associated metrics. The dashboard is organized into seven key worksheets to make tracking easy and efficient:
-
Home Sheet:
This is an index sheet with six buttons to help navigate to the other sheets.

Click to Customer Churn KPI
-
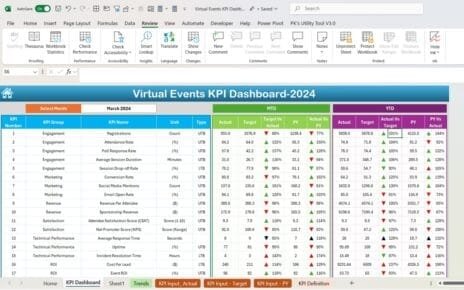
Dashboard Sheet Tab:
This is the main sheet where all KPI data is displayed. On range D3, you can select the month from a dropdown list, and the dashboard updates to show data for that month, including MTD (Month-to-Date) Actuals, Targets, Previous Year (PY) data, and KPIs.

Click to Customer Churn KPI
-
KPI Trend Sheet Tab:
This sheet allows you to select the KPI name from a dropdown (C3). It shows the KPI Group, Unit of the KPI, the type of KPI (whether “Lower the Better” or “Upper the Better”), the formula to calculate the KPI, and a brief definition.

Click to Customer Churn KPI
-
Actual Number Sheet Tab:
This sheet is where you input the actual numbers for YTD and MTD for each month. You can change the month in range E1 and input the data for the corresponding months.
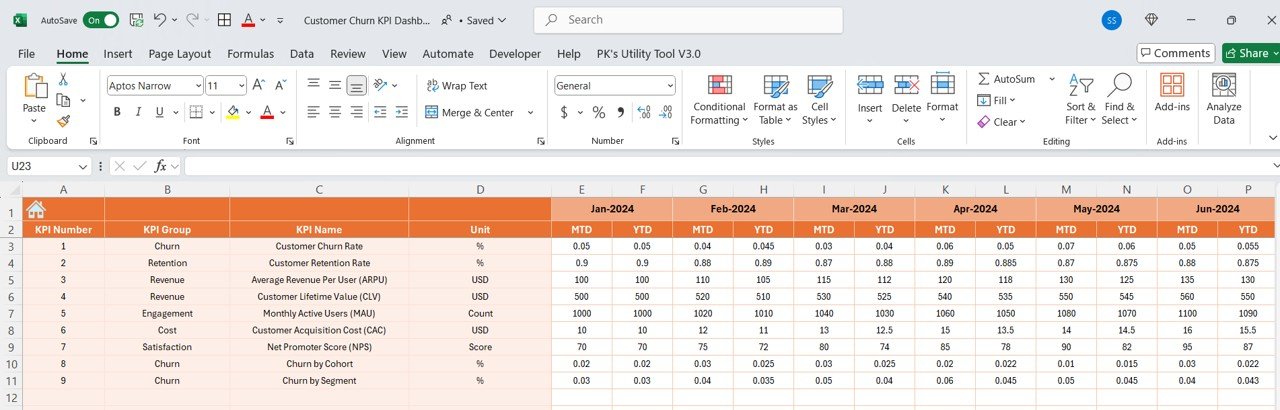
Click to Customer Churn KPI
-
Target Sheet Tab:
In this sheet, you enter the target numbers for each KPI for both MTD and YTD for each month. -
Previous Year Number Sheet Tab:
This tab is where you input the previous year’s figures for the same KPIs to compare current performance with past performance.
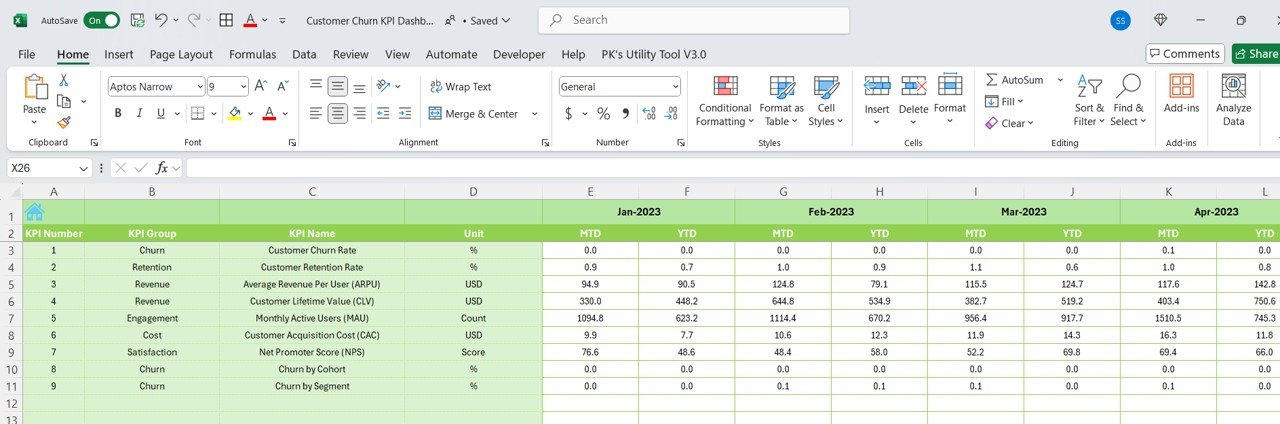
Click to Customer Churn KPI
-
KPI Definition Sheet Tab:
This sheet helps in organizing the definitions for each KPI, its group, unit, formula, and description.
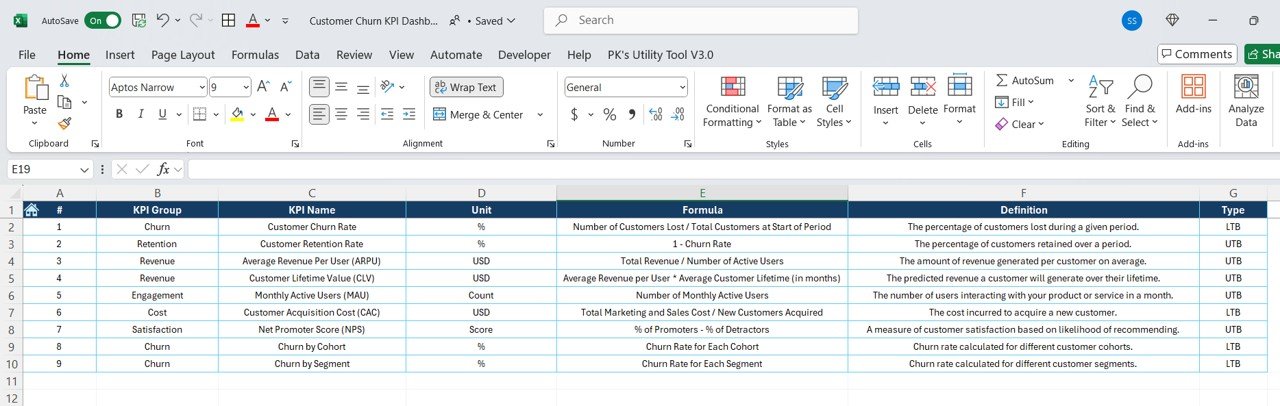
Click to Customer Churn KPI
Advantages of Using a Customer Churn KPI Dashboard
The Customer Churn KPI Dashboard offers numerous advantages that make it an essential tool for businesses focused on customer retention and growth. Here are a few key benefits:
- Real-Time Monitoring of Customer Retention: With a detailed dashboard, businesses can monitor their churn rate in real-time and take immediate actions to address any issues.
- Improved Customer Satisfaction: By regularly tracking and analyzing churn data, businesses can identify trends that may negatively impact customer satisfaction, allowing them to proactively improve their services.
- Increased Profitability: Reducing churn can directly affect a company’s bottom line. By improving retention, businesses can increase customer lifetime value (CLV), leading to higher profitability.
- Better Resource Allocation: By identifying which KPIs contribute most to churn, businesses can allocate resources more effectively to customer service, product development, or marketing.
Opportunity to Improve in Customer Churn KPI Dashboard
While the Customer Churn KPI Dashboard is powerful, there are always areas for improvement:
- Integrating More KPIs: To get a fuller picture of customer health, consider adding KPIs related to customer satisfaction, engagement, and feedback.
- Customization for Specific Business Needs: Customize the dashboard to include business-specific metrics that will provide a more targeted analysis.
- Improved Data Integration: Ensure that data from various sources (CRM, sales, customer service) is seamlessly integrated into the dashboard for more accurate reporting.
Best Practices for the Customer Churn KPI Dashboard
To make the most out of your Customer Churn KPI Dashboard, follow these best practices:
- Regularly Update the Data: Ensure that the dashboard reflects up-to-date information. Regular updates will keep the data relevant and actionable.
- Set Realistic Targets: Establish realistic and measurable targets for each KPI to ensure consistent tracking and progress.
- Use Conditional Formatting Effectively: Use conditional formatting, such as color coding and arrows, to quickly identify issues, trends, or successes in your KPIs.
- Analyze Trends, Not Just Data: Look for patterns over time, rather than focusing on one-off changes. This will provide more meaningful insights.
Frequently Asked Questions (FAQs)
1. What is Customer Churn Rate?
Customer churn rate measures the percentage of customers who leave a service over a specific period. A higher churn rate indicates customer dissatisfaction, while a lower rate signifies customer retention.
2. How Can I Reduce Churn?
To reduce churn, businesses should focus on improving customer satisfaction, offering value-added services, personalizing customer experiences, and staying ahead of competitors.
3. Why is NPS Important in Tracking Customer Churn?
NPS is a crucial indicator of customer loyalty and satisfaction. A high NPS typically correlates with lower churn rates, making it essential for measuring overall customer retention.
4. What KPIs Should Be Tracked Alongside Churn?
Along with churn, businesses should track customer acquisition cost (CAC), average revenue per user (ARPU), and customer lifetime value (CLV) to get a complete view of customer health.
Conclusion
The Customer Churn KPI Dashboard is an invaluable tool for businesses looking to monitor, analyze, and improve their customer retention strategies. By tracking essential KPIs like churn rate, retention rate, and NPS, businesses can identify problem areas and take proactive steps to ensure long-term customer satisfaction. Regular monitoring, data integration, and best practices will help you build a more effective churn strategy and maintain a loyal customer base.
Visit our YouTube channel to learn step-by-step video tutorials