
The Business Intelligence KPI Dashboard in Excel is a powerful, ready-to-use template designed to help businesses track key performance indicators (KPIs) effectively. This dynamic dashboard enables data-driven decision-making by providing real-time insights into monthly and yearly performance metrics. With interactive drop-down selections, automated calculations, and visually engaging charts, this tool simplifies KPI analysis without the need for complex BI software.
Key Features of the Business Intelligence KPI Dashboard in Excel
Home Sheet:
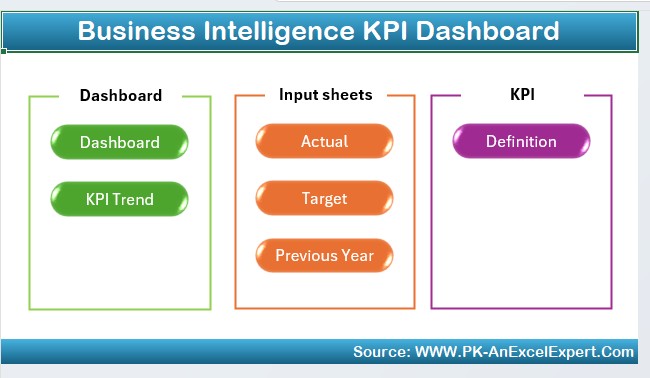
- A user-friendly navigation page with six clickable buttons for easy access to different sections of the dashboard.
Dashboard Sheet (Main Dashboard):
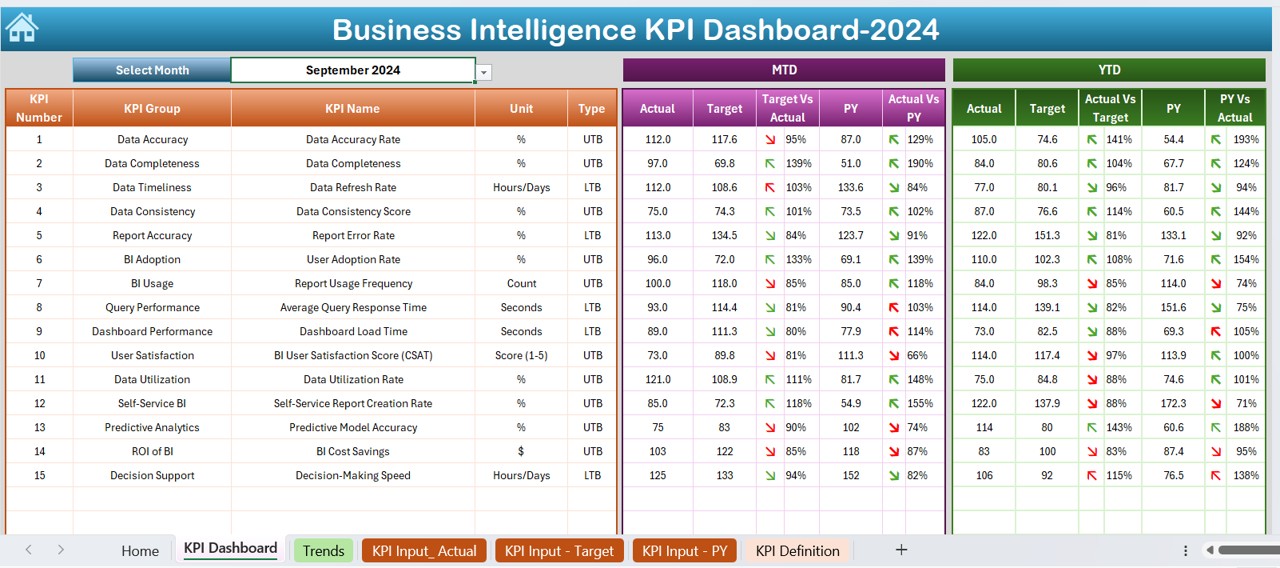
- Provides a comprehensive KPI overview with real-time data updates based on month selection.
- Displays MTD & YTD Actuals, Targets, and Previous Year comparisons.
- Uses conditional formatting (up/down arrows) to highlight trends in performance.
KPI Trend Sheet:
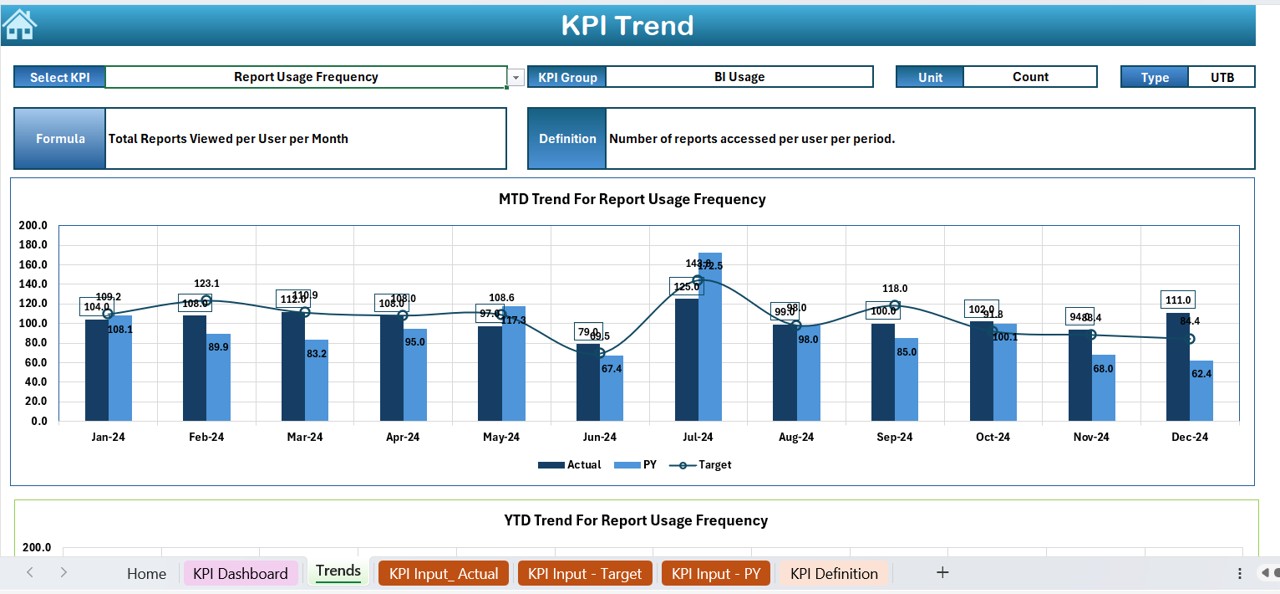
- Allows users to select specific KPIs and analyze trends using interactive drop-downs.
- Displays KPI group, unit, formula, and type (Lower is Better or Upper is Better).
- Features MTD & YTD trend charts to visualize performance over time.
Actual Numbers Input Sheet:
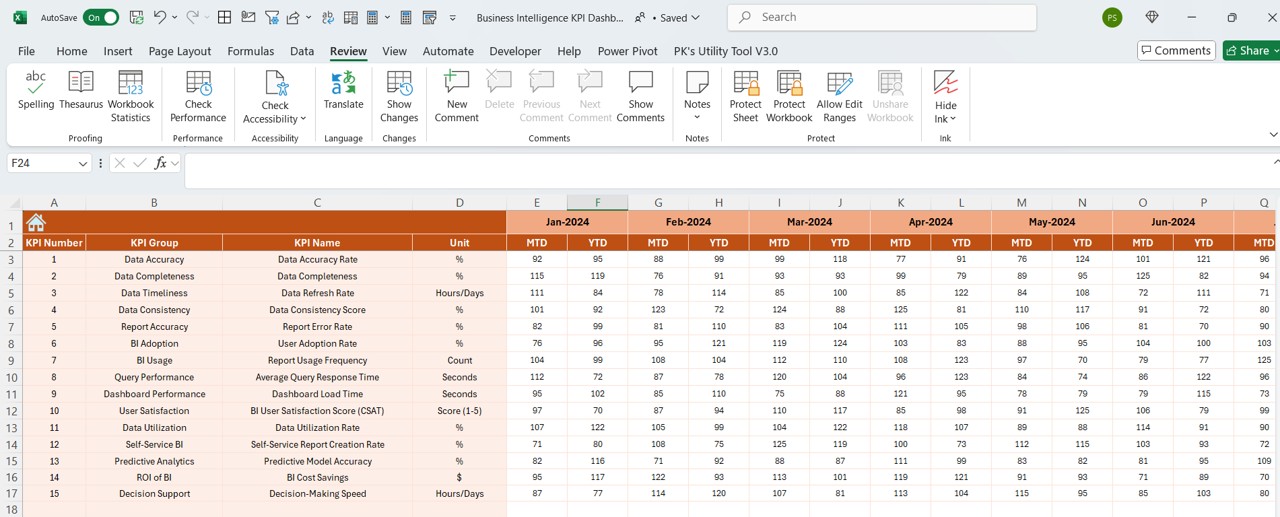
- Users can input actual KPI values for MTD and YTD tracking.
- Month selection is available via cell E1, enabling seamless updates.
Target Sheet:
- Allows businesses to set KPI targets for MTD and YTD.
- Helps compare actual performance with business goals effectively.
Previous Year Numbers Sheet:
- Stores historical KPI data to track progress and performance improvements.
KPI Definition Sheet:
- Maintains a detailed record of KPIs, including their name, group, unit, formula, and definition.
- Ensures standardized KPI tracking across departments.


