Managing sustainability performance is essential for organizations striving to meet environmental, social, and governance (ESG) goals. Our Sustainability Metrics KPI Dashboard in Excel provides a ready-to-use template that enables businesses to track key sustainability indicators effortlessly. With automated calculations and interactive dashboards, users can monitor, analyze, and improve sustainability performance in one centralized tool.
Key Features
Home Sheet
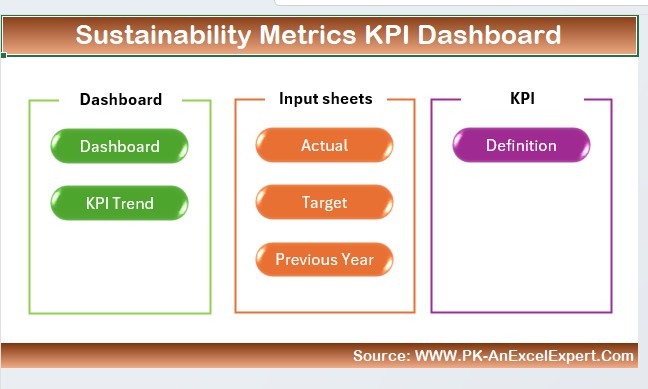
Acts as an index page with quick navigation buttons for seamless access to different sections.
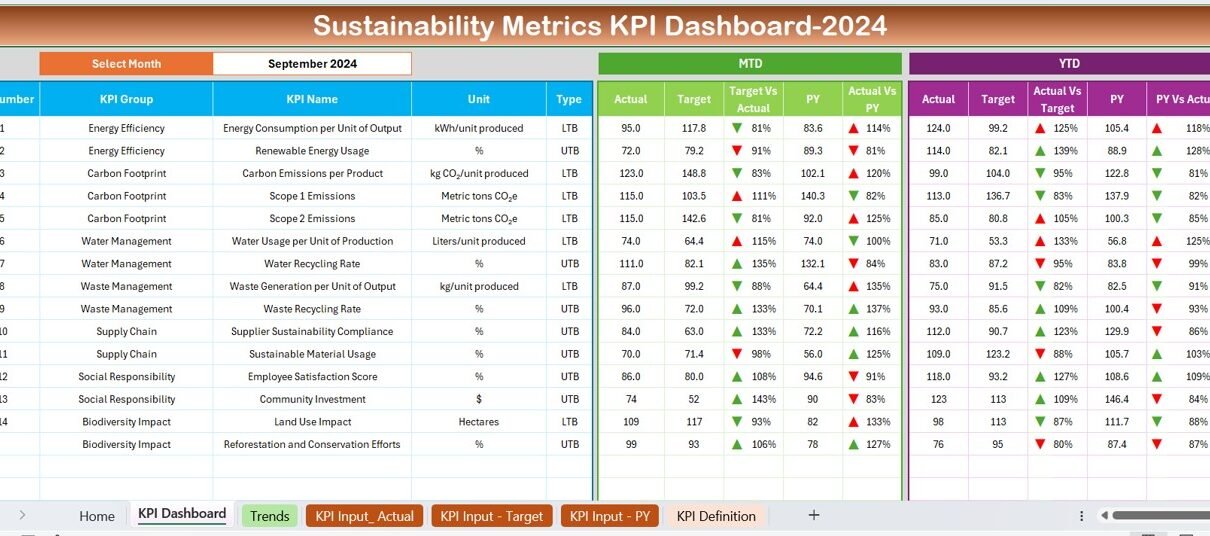
Dashboard Sheet
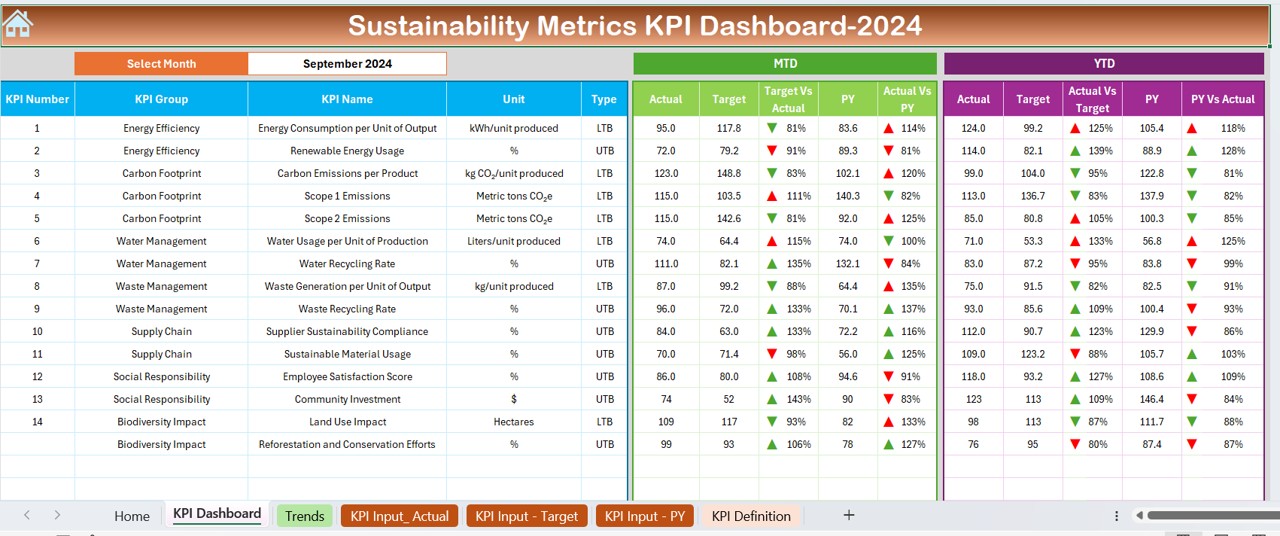
Provides a real-time overview of sustainability KPIs, allowing users to select a specific month and track performance trends using conditional formatting indicators.
KPI Trend Sheet
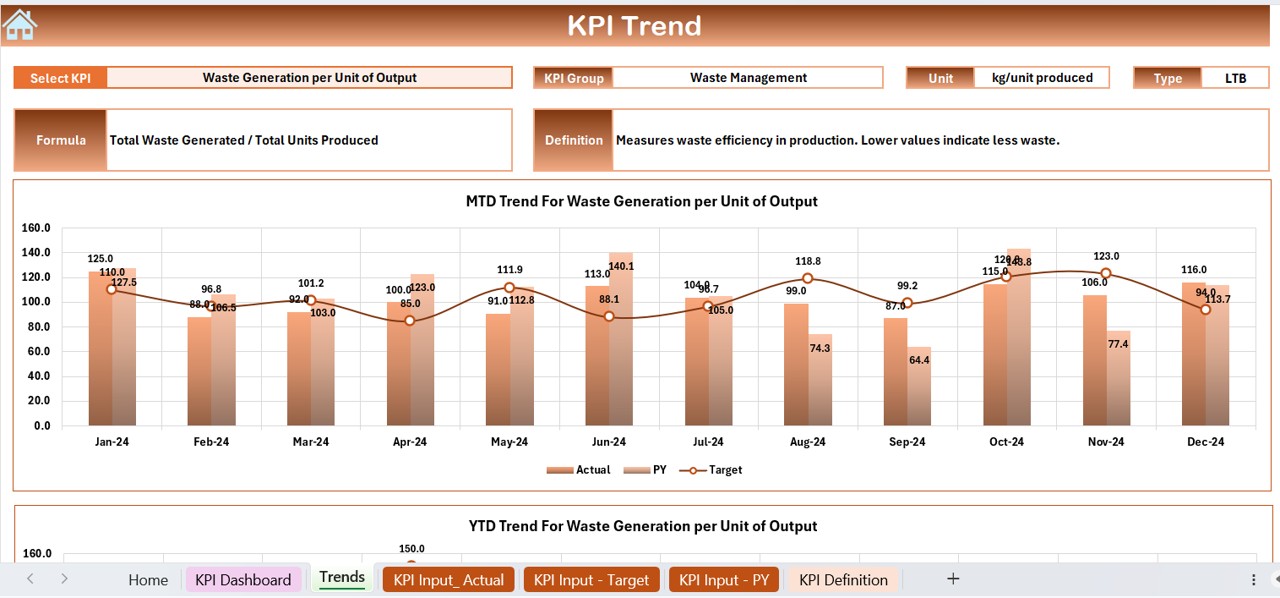
Enables users to select a KPI and view detailed information, trends, and calculations for MTD (Month-to-Date) and YTD (Year-to-Date) performance.
Actual Numbers Input Sheet
Allows for easy manual data entry of actual sustainability numbers for better tracking and comparison.
Target Sheet
Facilitates setting monthly and yearly target values for sustainability KPIs.
Previous Year Numbers Sheet
Stores historical data to compare past and present sustainability performance.
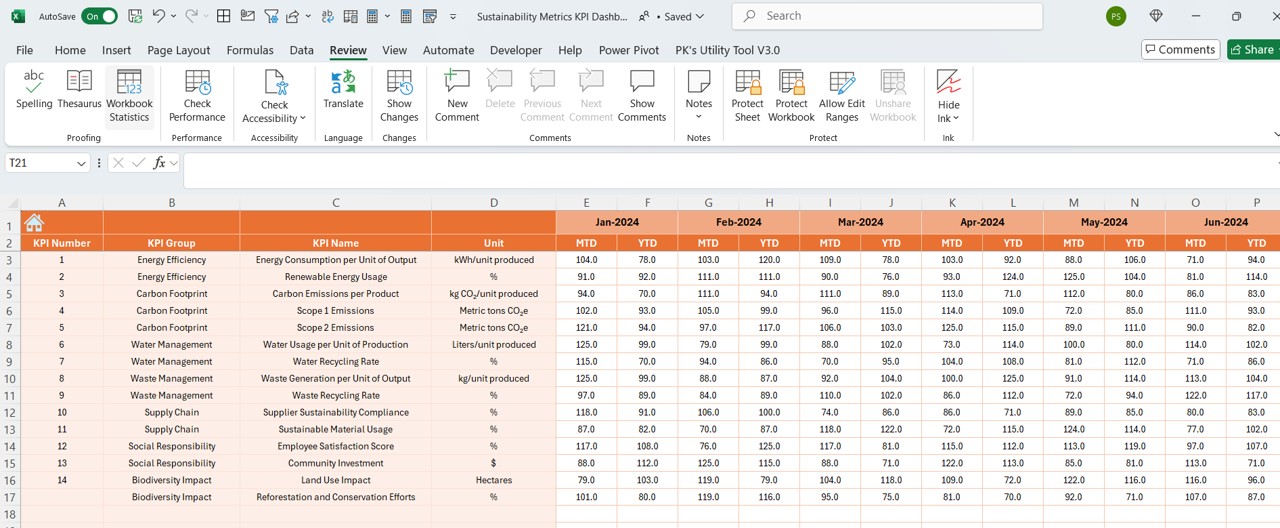
KPI Definition Sheet
A structured database containing KPI names, groups, units, formulas, and definitions for easy reference.