In today’s competitive business world, cross-selling plays a crucial role in maximizing revenue by offering customers complementary products. Tracking the effectiveness of cross-selling efforts, however, requires more than just basic sales data. That’s where the Cross-Selling KPI Dashboard comes in. This tool empowers businesses to monitor, analyze, and optimize their cross-selling strategies through key performance indicators (KPIs).
Our Cross-Selling KPI Dashboard in Excel is designed to help businesses efficiently track performance and make data-driven decisions. With real-time data and detailed analytics, this dashboard enhances cross-selling efforts, increasing both sales and customer satisfaction.
Key Features of the Cross-Selling KPI Dashboard in Excel
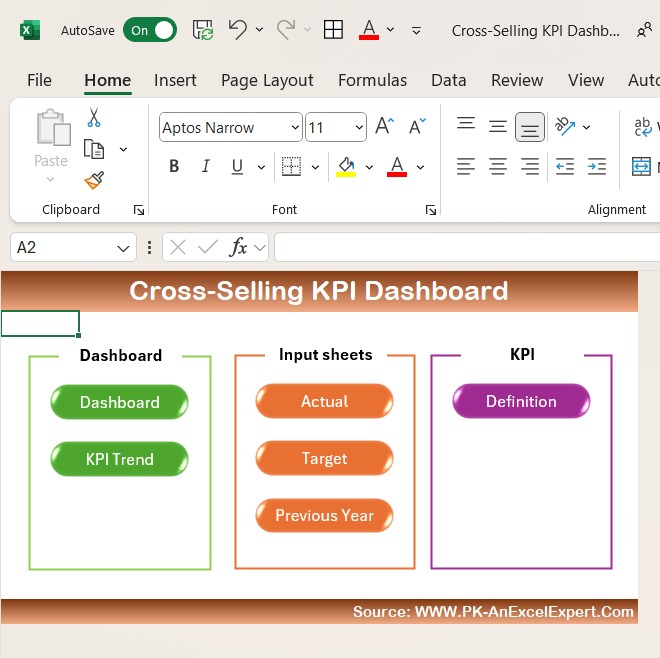
- Home Sheet: Navigate to different sections easily with six buttons, ensuring quick access to all key performance data.
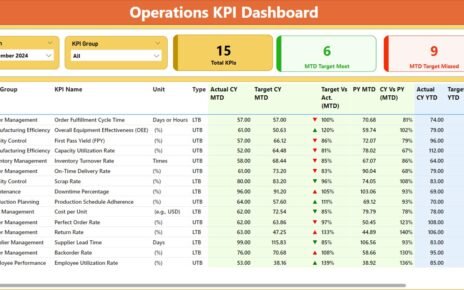
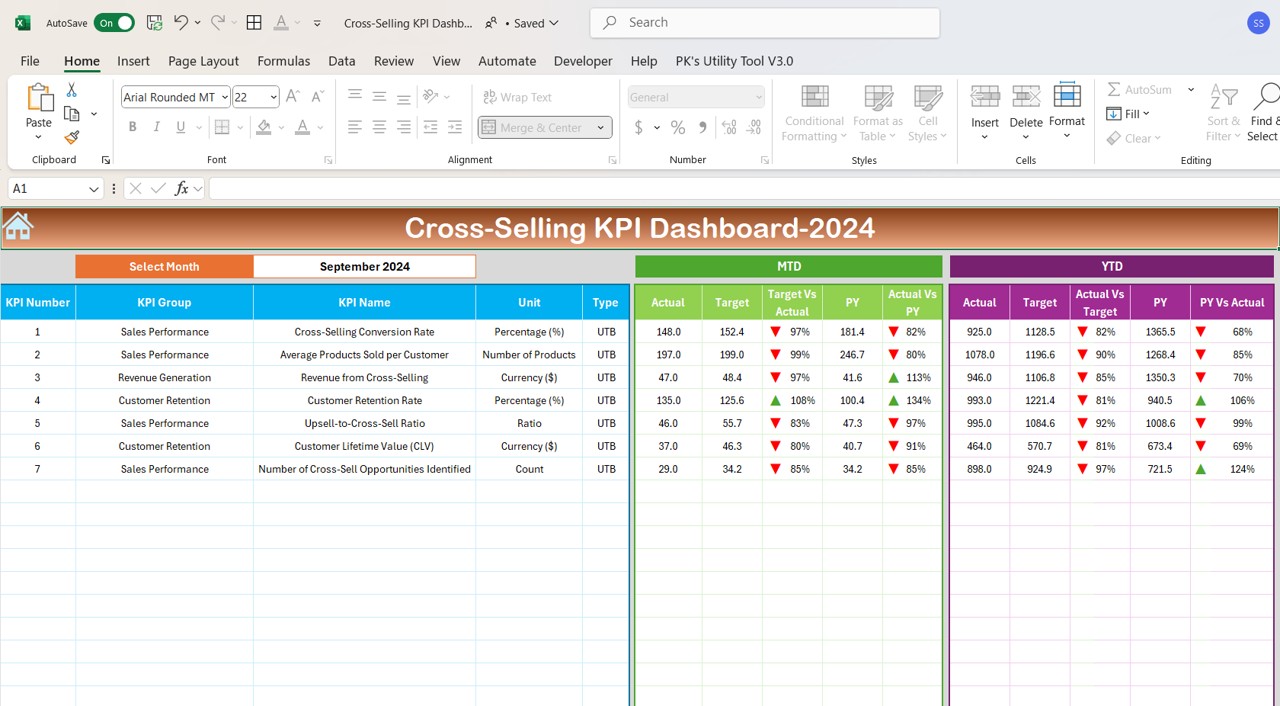
- Dashboard Sheet Tab: View comprehensive cross-selling performance, including MTD (Month-to-Date) and YTD (Year-to-Date) metrics, with visual indicators like arrows to reflect progress.
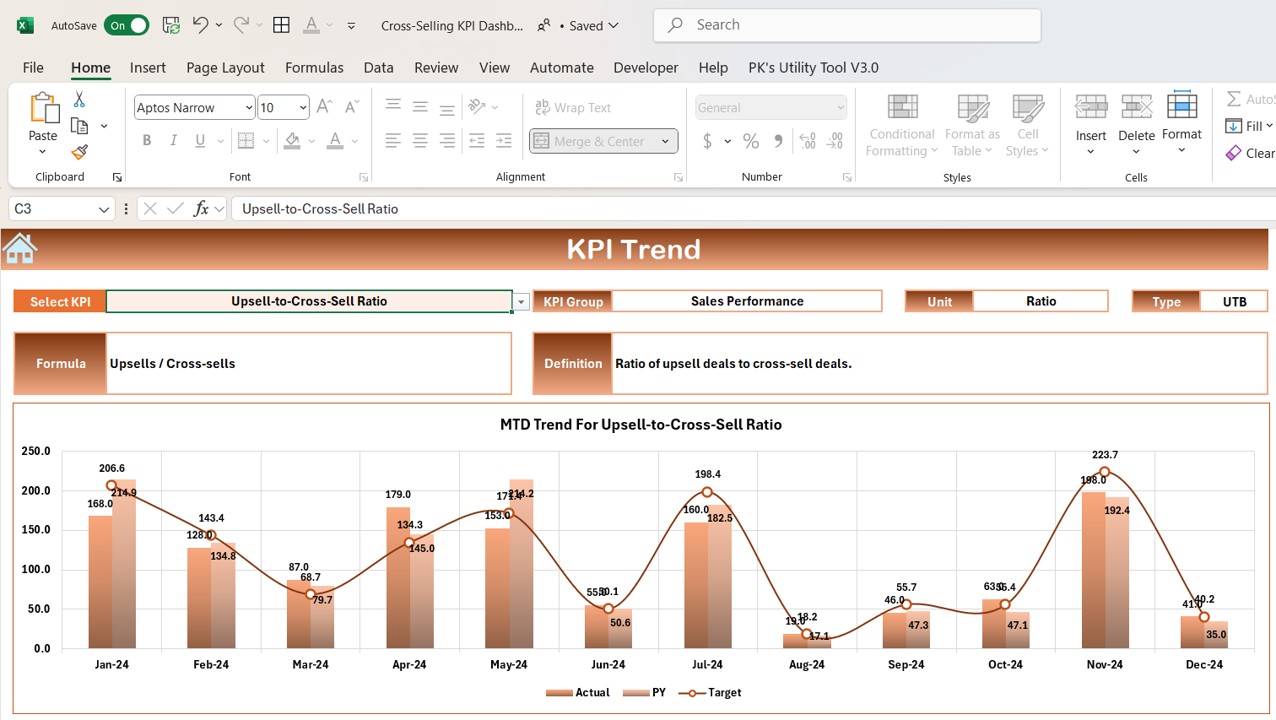
- KPI Trend Sheet Tab: Analyze KPI trends over time, selecting specific KPIs and reviewing their group, unit, formula, and definition.
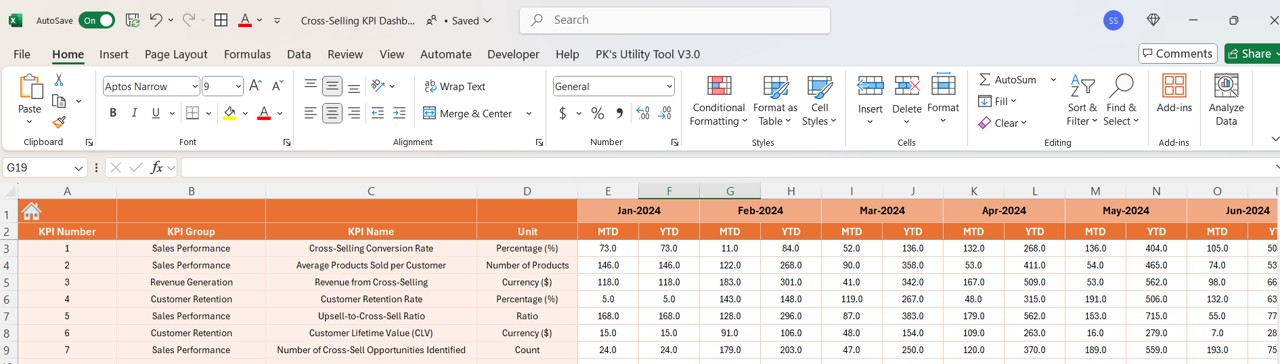
- Actual Numbers Sheet Tab: Enter and track actual numbers for MTD and YTD across months.
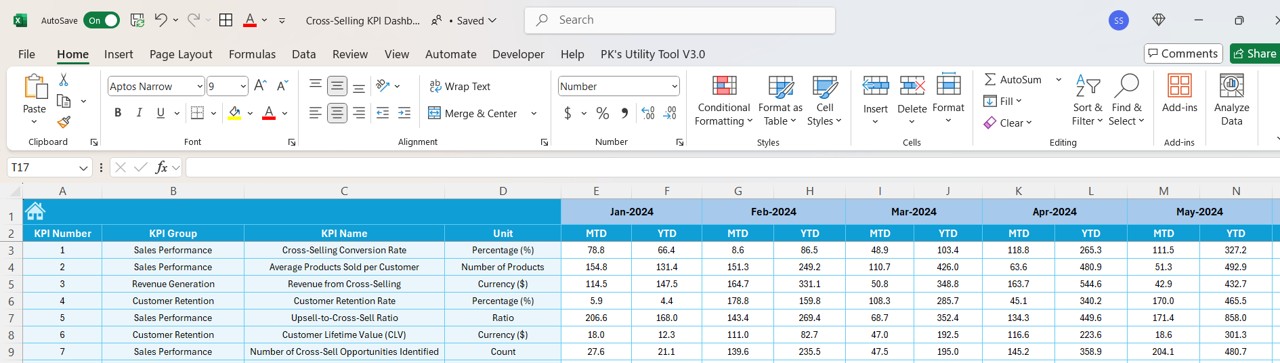
- Target Sheet Tab: Input target values to compare with actual performance, allowing for performance tracking against goals.
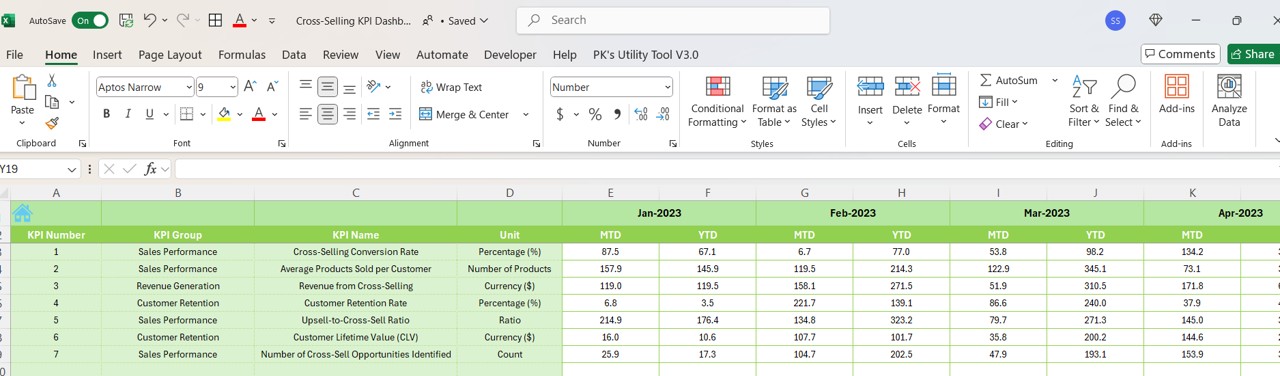
- Previous Year Numbers Sheet Tab: Analyze year-over-year performance with ease by entering previous year data.
- KPI Definition Sheet Tab: Define each KPI in detail, providing clarity and understanding across the board.