In today’s customer-centric business environment, tracking and improving customer feedback is more important than ever. A Customer Feedback KPI Dashboard is a powerful tool that helps businesses monitor and analyze key performance indicators (KPIs) related to customer feedback. By doing so, companies can enhance their products, services, and overall customer experience.
A well-organized KPI dashboard provides clarity on various aspects of customer satisfaction and loyalty. This article will explore the Customer Feedback KPI Dashboard, its key features, KPIs, and the advantages it offers. Furthermore, we will dive into opportunities for improvement and best practices to make the most out of your feedback system.
What is a Customer Feedback KPI Dashboard?
A Customer Feedback KPI Dashboard is an interactive tool that aggregates key data points related to customer satisfaction, loyalty, retention, and service performance. It is designed to give businesses real-time insights into how well they are meeting customer expectations and where improvements can be made.
Key Features of the Customer Feedback KPI Dashboard
Our Customer Feedback KPI Dashboard is a ready-to-use solution designed for businesses aiming to optimize customer experience. It is composed of seven key worksheets that work together to provide a comprehensive overview of customer feedback data:
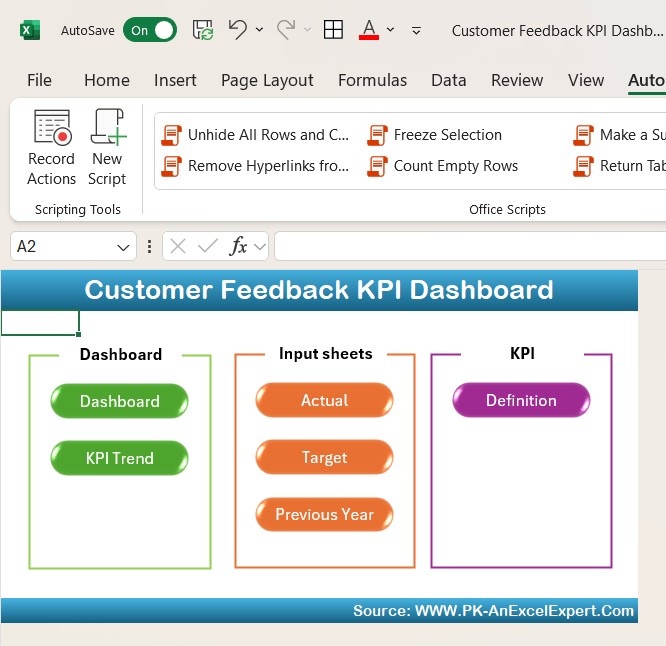
Home Sheet:
This is the index sheet with six buttons, making it easy to jump to the relevant sheet.
Click to Customer Feedback KPI
Dashboard Sheet Tab:
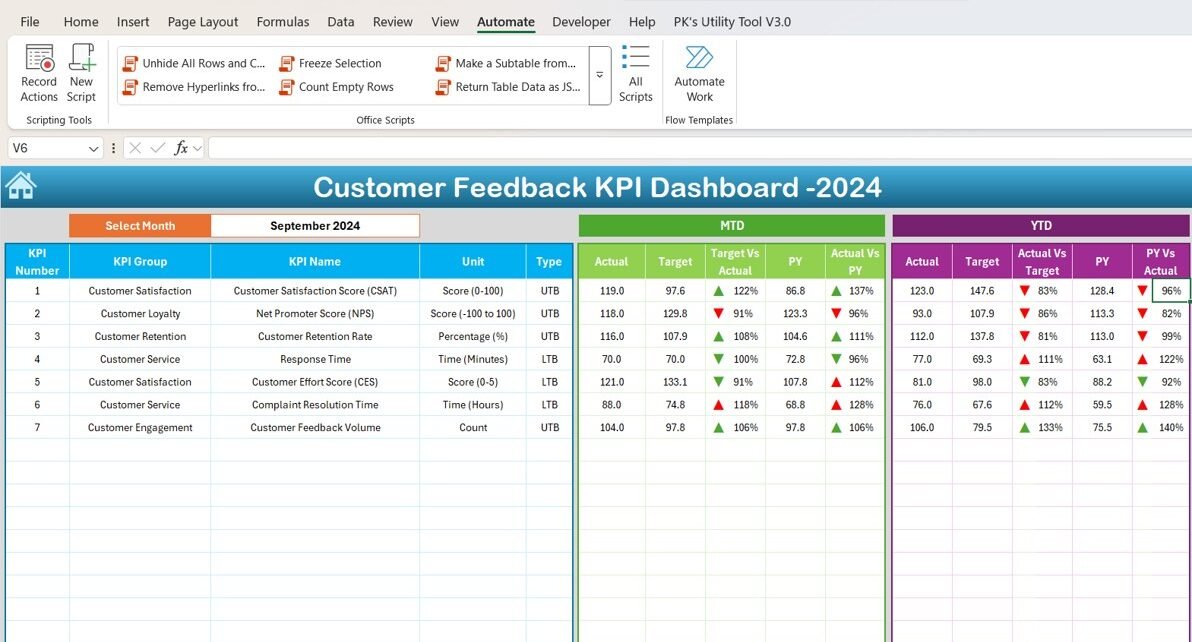
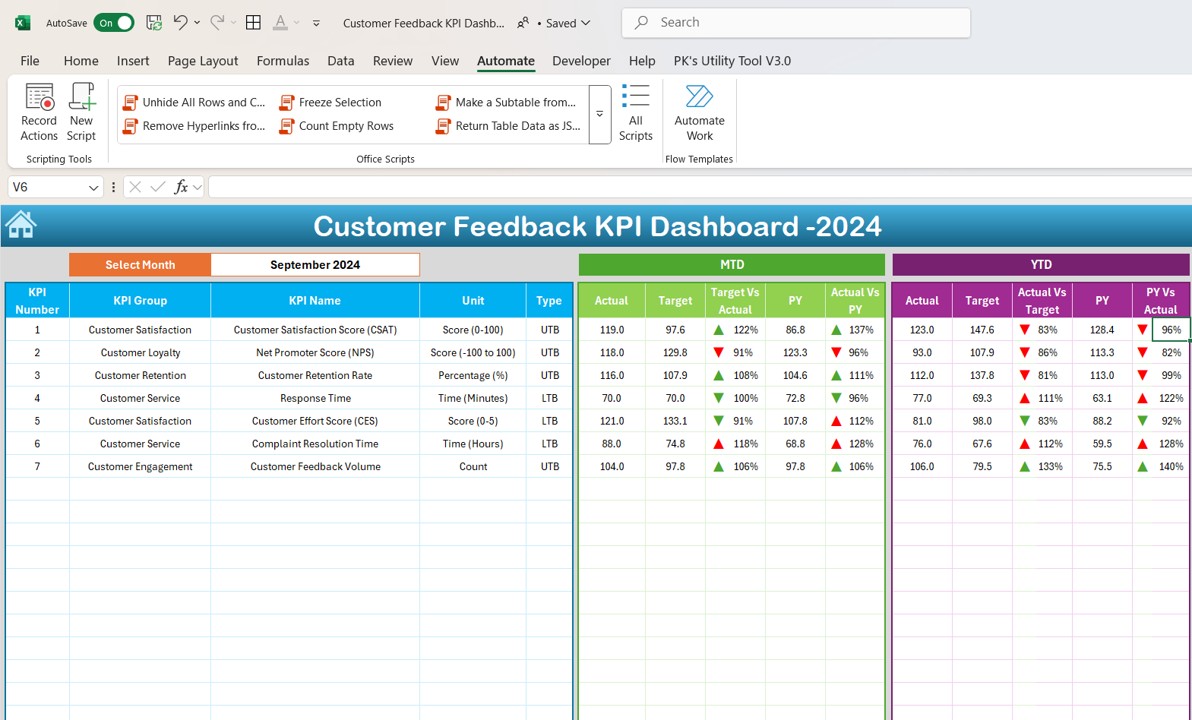
This sheet displays all key feedback information. It allows you to select the month from a drop-down menu (Range D3), and all data will update accordingly. It shows MTD (Month-to-Date) and YTD (Year-to-Date) actuals, targets, and previous year data with conditional formatting and up/down arrows for easy comparison.
Click to Customer Feedback KPI
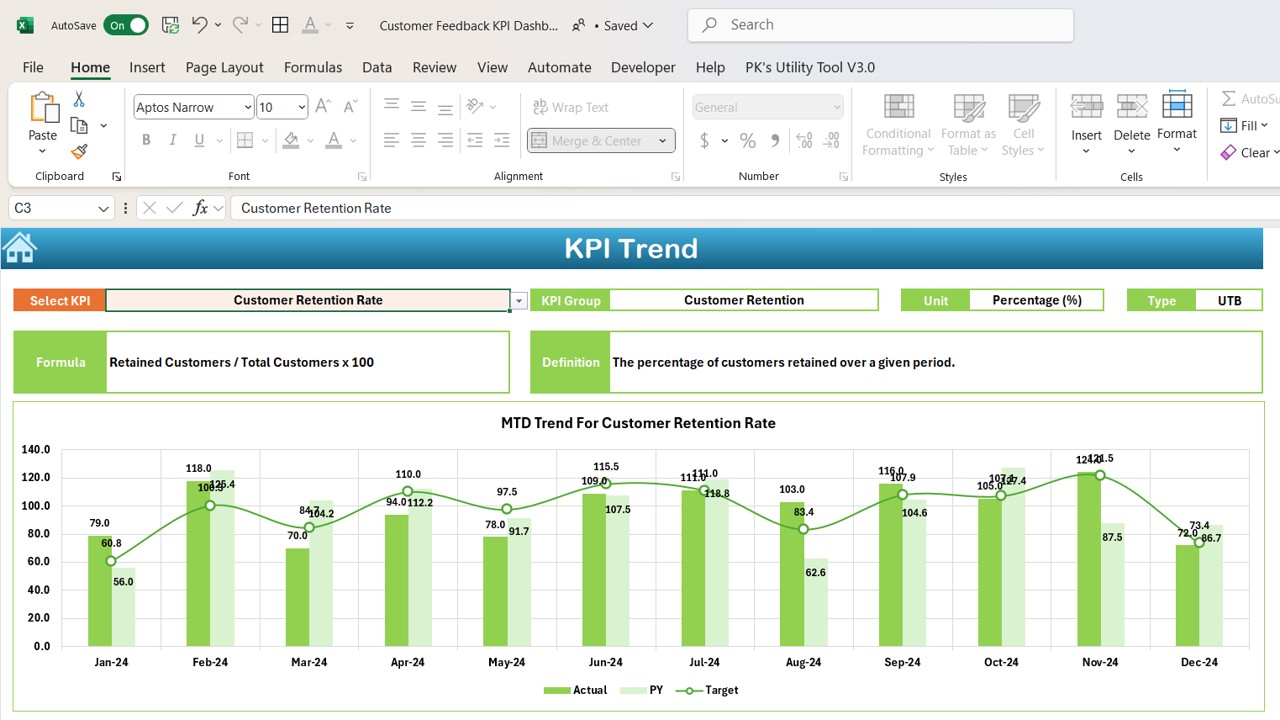
KPI Trend Sheet Tab:
Here, you can select the KPI from a drop-down list. It displays the KPI group, unit, type (whether lower or upper is better), formula, and definition of the selected KPI.
Click to Customer Feedback KPI
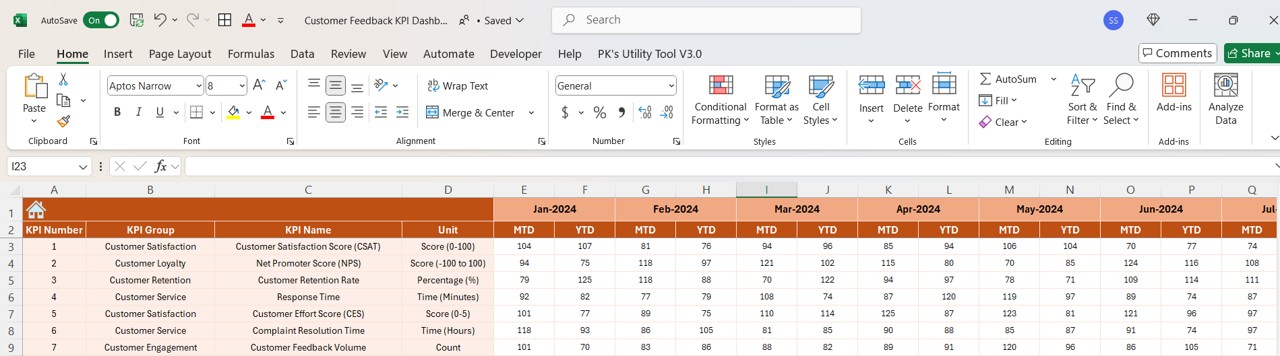
Actual Number Sheet Tab:
This tab allows you to input actual feedback numbers for MTD and YTD for a specific month.
Click to Customer Feedback KPI
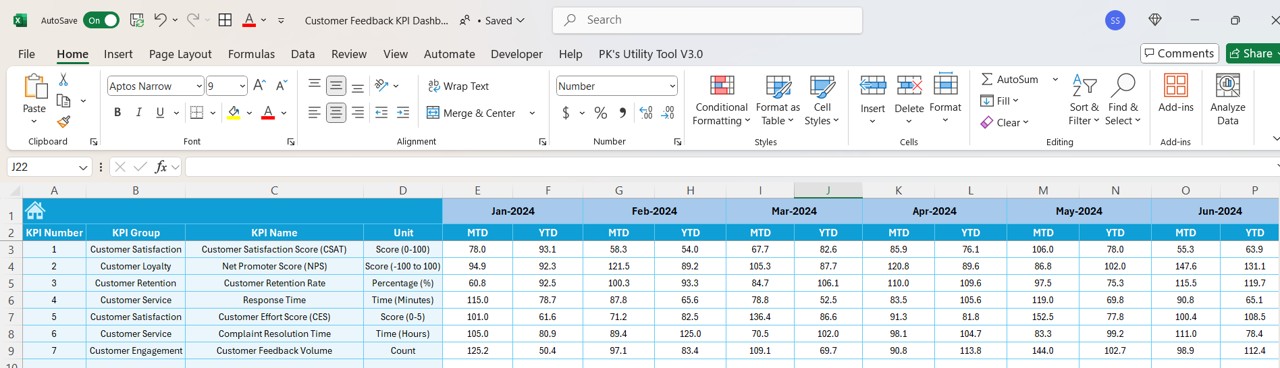
Target Sheet Tab:
Here, you input the target values for each KPI for MTD and YTD. This helps you track how well you’re meeting your goals.
Click to Customer Feedback KPI
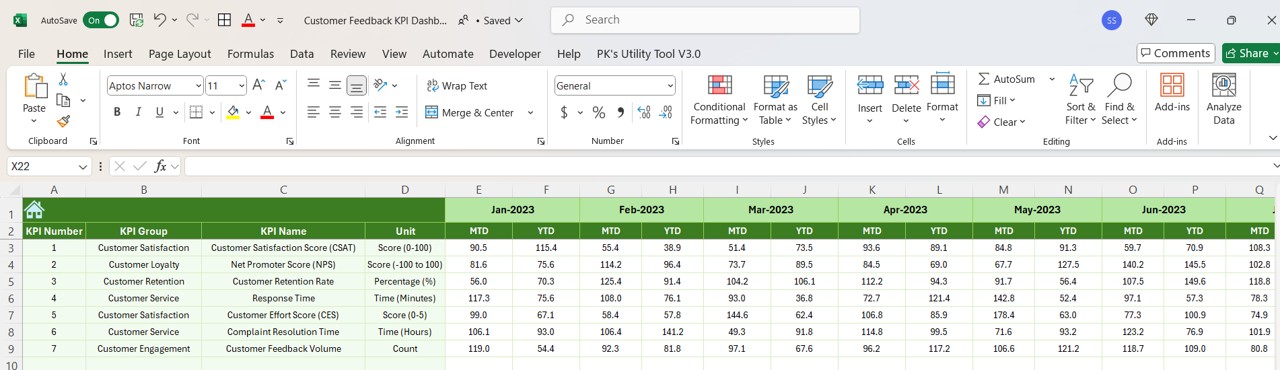
Previous Year Number Sheet Tab:
Enter the previous year’s data for comparison, providing a year-over-year analysis.
Click to Customer Feedback KPI
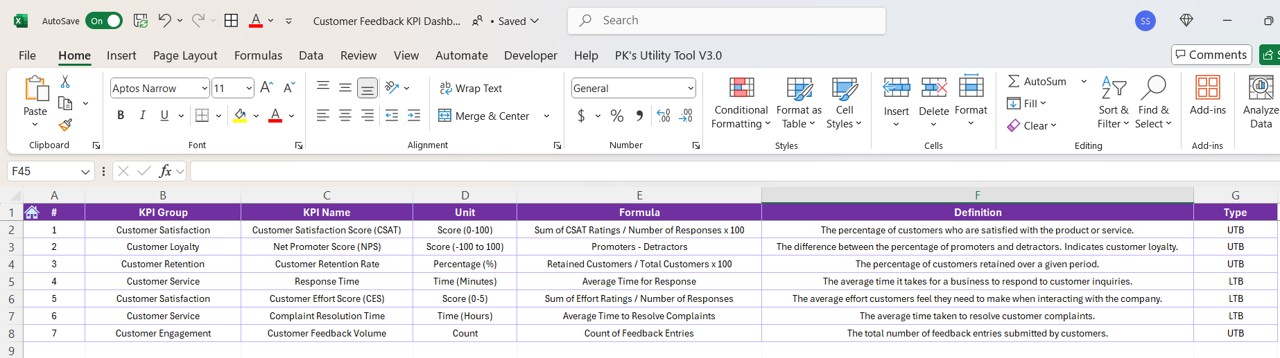
KPI Definition Sheet Tab:
This sheet includes detailed definitions for each KPI, helping users understand the key metrics better.
Click to Customer Feedback KPI
Advantages of the Customer Feedback KPI Dashboard
Using a Customer Feedback KPI Dashboard offers several advantages that help businesses make informed decisions and enhance customer experience:
- Improved Decision Making: By having real-time data on customer satisfaction, loyalty, and service performance, decision-makers can make better-informed choices about product and service improvements.
- Enhanced Customer Retention; By tracking KPIs like Customer Retention Rate and CES, businesses can focus on retaining customers by addressing their needs and minimizing customer effort.
- Increased Customer Satisfaction: Monitoring CSAT and NPS allows businesses to pinpoint areas of improvement and increase overall customer satisfaction.
- Faster Issue Resolution: The Response Time and Complaint Resolution Time KPIs enable businesses to identify bottlenecks in their customer service process and improve the speed of resolving customer issues.
- Holistic Customer Feedback Analysis; The ability to view different KPIs together gives businesses a more complete picture of their customers’ feedback, enabling more effective strategic planning.
Opportunities for Improvement in the Customer Feedback KPI Dashboard
While the Customer Feedback KPI Dashboard is a powerful tool, there are always opportunities to optimize its usage and add new features. Here are a few suggestions for improvement:
- Integration with CRM Systems: Integrating the dashboard with a Customer Relationship Management (CRM) system can provide real-time customer feedback data, making the dashboard even more efficient.
- Incorporating Social Media Feedback: Integrating customer feedback from social media platforms can provide a more comprehensive understanding of customer sentiment.
- Adding Predictive Analytics: Predictive analytics could forecast future customer satisfaction trends, helping businesses proactively address potential issues before they arise.
- Advanced Data Visualizations: Adding interactive charts and heat maps could enhance the dashboard’s ability to visualize trends and insights, making it easier for teams to interpret the data.
- Customizable Dashboards: Allowing businesses to customize which KPIs to display and how they are organized will enable them to focus on the most relevant metrics for their goals.
Best Practices for the Customer Feedback KPI Dashboard
To maximize the benefits of the Customer Feedback KPI Dashboard, follow these best practices:
- Regularly Update Data: Ensure that data for MTD and YTD metrics is updated frequently to reflect the latest feedback and keep the dashboard accurate.
- Set Realistic Targets: Base your targets on historical data to avoid setting unrealistic goals that could skew performance analysis.
- Monitor Trends Over Time: Rather than focusing solely on short-term data, monitor customer feedback trends over time to identify long-term patterns and insights.
- Customize the Dashboard: Customize the dashboard to focus on the KPIs most relevant to your business objectives. This helps ensure that teams can focus on the data that matters most.
- Leverage Feedback for Continuous Improvement: Use the data from the dashboard to continuously refine your customer service, product development, and sales strategies.
Frequently Asked Questions (FAQs)
1. What is a Customer Feedback KPI Dashboard?
A Customer Feedback KPI Dashboard is a tool that businesses use to track and analyze key performance indicators (KPIs) related to customer satisfaction, loyalty, and service performance.
2. Why is Customer Feedback Important?
Customer feedback is essential for understanding how well a business is meeting customer expectations. It helps companies identify areas of improvement and optimize their products or services.
3. How Do I Use the Customer Feedback KPI Dashboard?
To use the dashboard, simply input the actual feedback data (MTD and YTD) in the respective sheets, and the dashboard will automatically update to reflect real-time performance.
4. What KPIs are Included in the Customer Feedback KPI Dashboard?
The dashboard includes KPIs such as Customer Satisfaction Score (CSAT), Net Promoter Score (NPS), Customer Retention Rate, Response Time, and more.
5. How Often Should I Update the Data in the Dashboard?
It’s important to update the data regularly (monthly or quarterly) to ensure the dashboard reflects the most accurate and up-to-date feedback.
Conclusion
The Customer Feedback KPI Dashboard is a powerful tool for businesses that want to optimize their customer service, retain loyal customers, and improve their products and services. By tracking key KPIs and analyzing customer feedback data, businesses can make informed decisions and ensure they meet customer expectations. By following best practices, businesses can use this dashboard to continuously improve and achieve long-term success.
Visit our YouTube channel to learn step-by-step video tutorials


