Succession planning is a critical component of workforce management, ensuring that organizations have the right talent in place to maintain business continuity. With a Succession Planning KPI Dashboard in Excel, you can effectively track, monitor, and analyze key performance indicators (KPIs) related to succession planning.
In this article, we will walk you through how this ready-to-use dashboard can help HR professionals and business leaders make data-driven decisions. We will also explore its key features, advantages, and best practices for efficient succession planning.
Click to buy Succession Planning
What is a Succession Planning KPI Dashboard?
A Succession Planning KPI Dashboard is an interactive tool that provides insights into talent readiness, leadership gaps, and workforce planning trends. By tracking key performance indicators (KPIs), this dashboard helps organizations identify high-potential employees and ensure a seamless leadership transition.
This Excel-based dashboard offers real-time updates and powerful visualizations, making it easy to interpret workforce trends at a glance.
Key Features of the Succession Planning KPI Dashboard
Our Succession Planning KPI Dashboard in Excel includes seven dedicated sheets to streamline workforce management. Below is an overview of each sheet:
Home Sheet
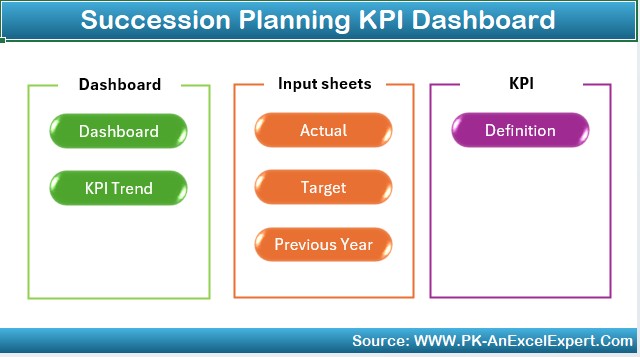
- Acts as an index page with six buttons that allow users to navigate to different sections of the dashboard easily.
- Enhances user experience by providing a structured workflow.
Click to buy Succession Planning
Dashboard Sheet Tab
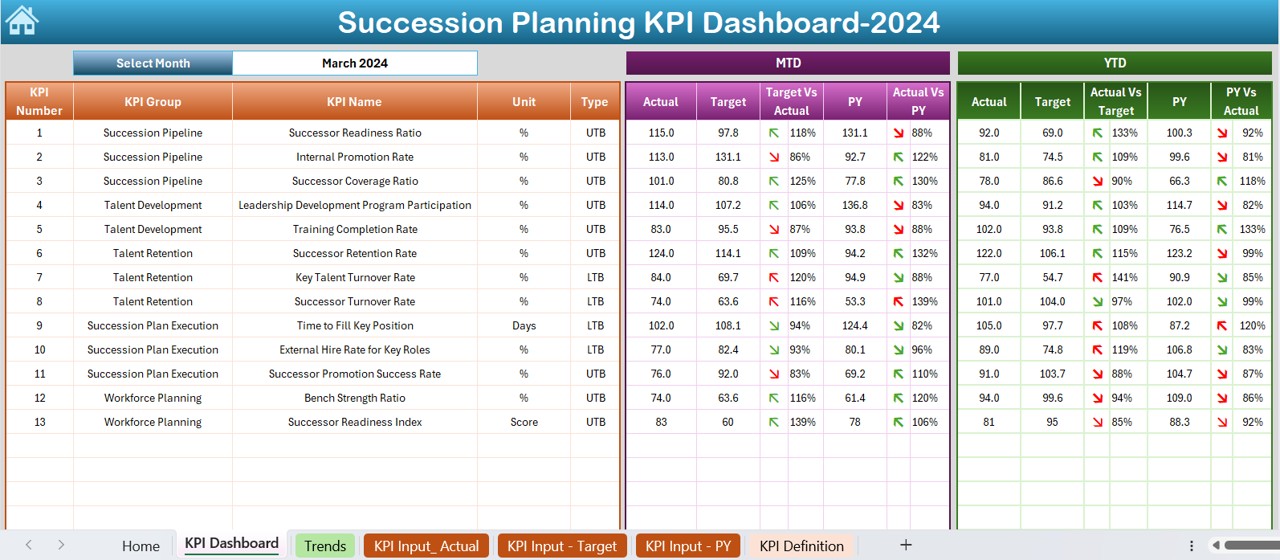
- Displays all key KPI metrics in a structured manner.
- Users can select the month from a drop-down (Range D3), and all data updates accordingly.
- Showcases MTD (Month-to-Date) and YTD (Year-to-Date) data, including:
- Actual vs. Target Performance
- Current Year vs. Previous Year Comparison
- Uses conditional formatting with up/down arrows to highlight performance trends.
KPI Trend Sheet Tab
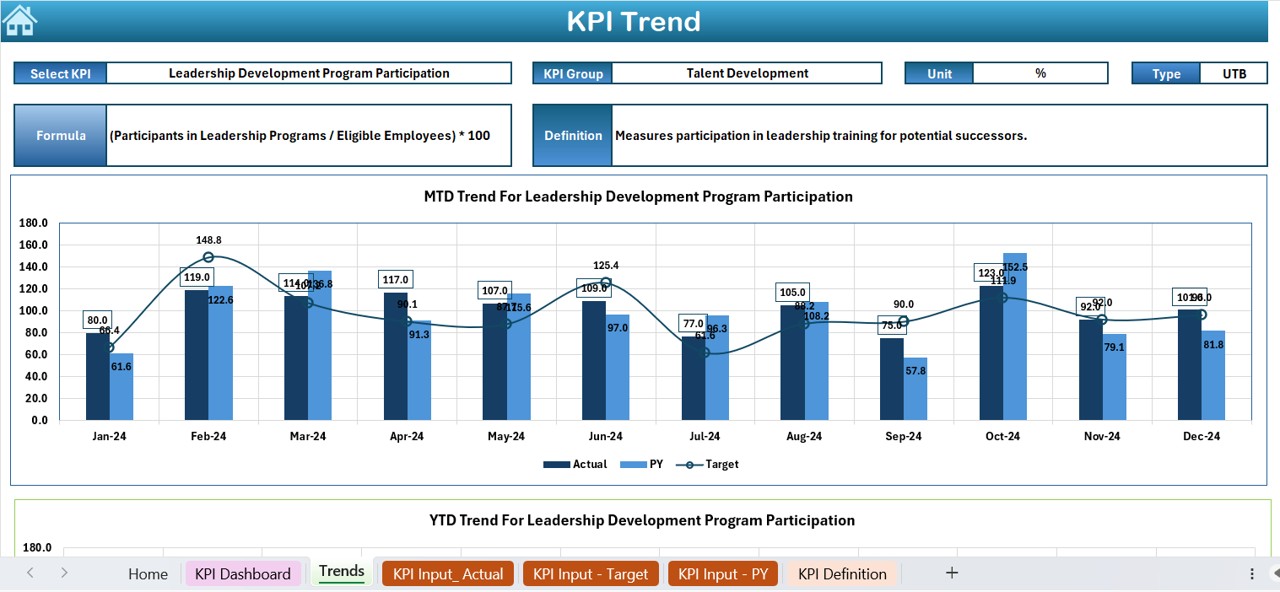
- Allows users to select a KPI name (Range C3) from a drop-down menu.
- Displays essential KPI details:
- KPI Group
- Unit of Measurement
- KPI Type (Lower is Better or Higher is Better)
- KPI Formula & Definition
- Provides a trend chart to visualize MTD and YTD performance.
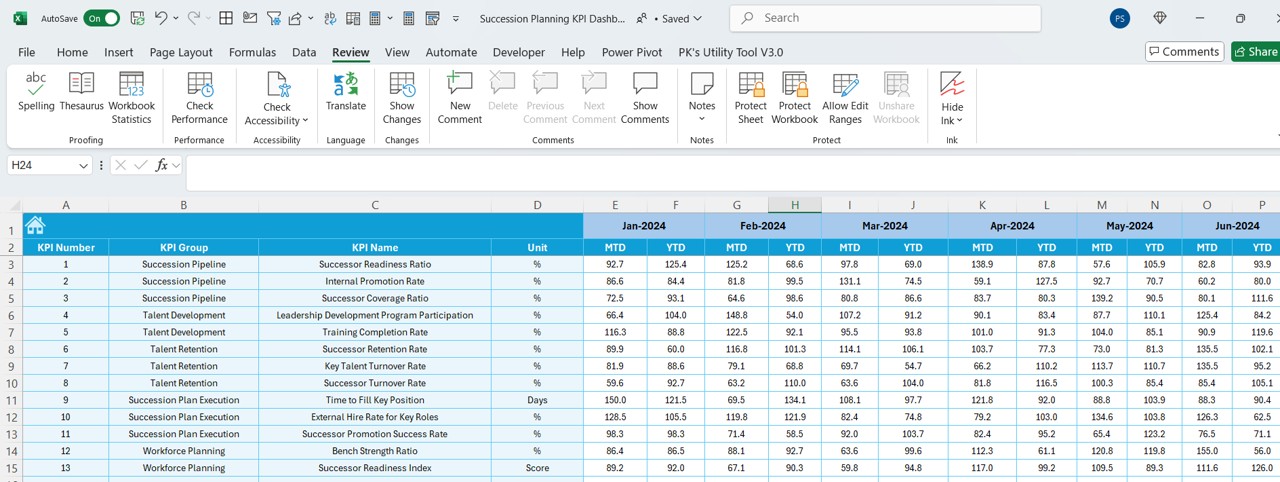
Actual Numbers Input Sheet
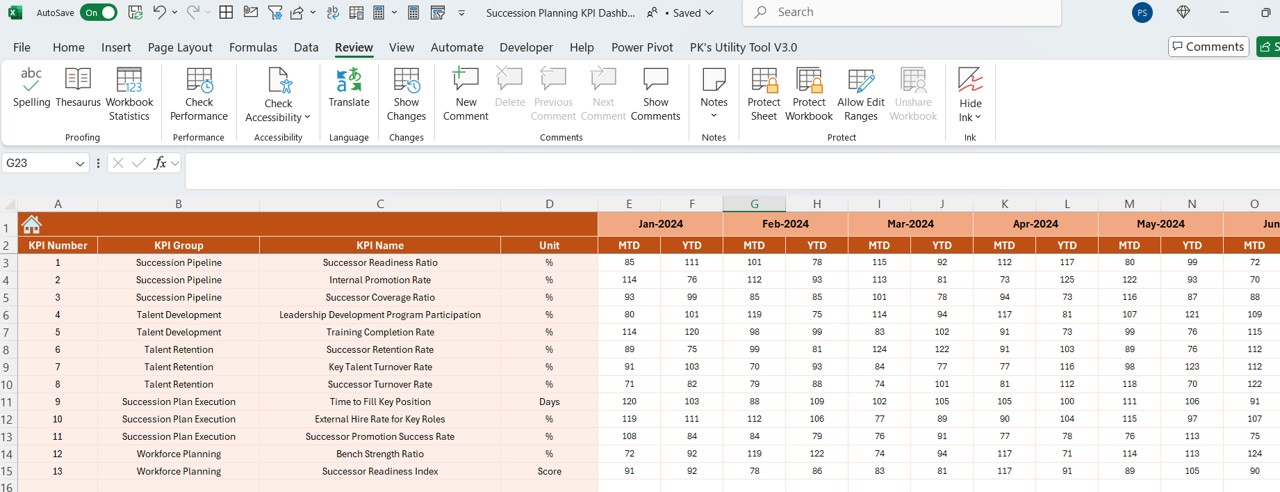
- Enables users to input actual values for each KPI.
- Users can change the month by updating Range E1.
- Ensures data accuracy and allows dynamic updates to the dashboard.
Click to buy Succession Planning
Target Sheet Tab
- Allows entry of monthly and yearly targets for each KPI.
- Helps compare actual results with expected performance benchmarks.
Previous Year Numbers Sheet Tab
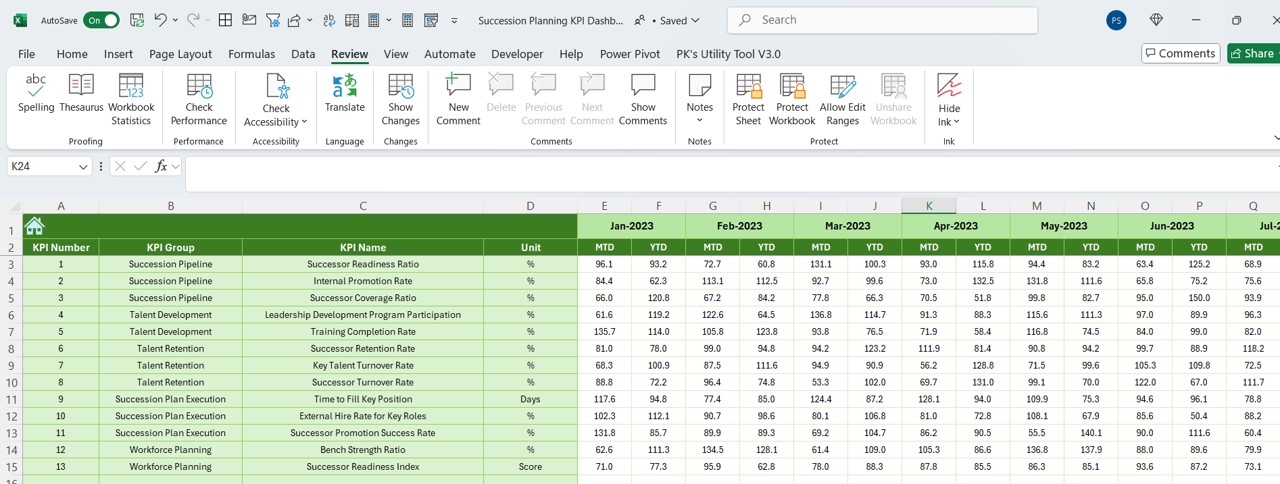
- Users can record previous year’s data in the same format as the current year.
- Enables performance comparison for trend analysis.
KPI Definition Sheet Tab
- Stores all KPI-related details, including:
- KPI Name
- KPI Group
- Unit of Measurement
- Formula
- Definition
- Acts as a reference guide for users.
Advantages of Using a Succession Planning KPI Dashboard in Excel
- Centralized Data Management: All succession planning KPIs are stored in one place, making it easy to access and analyze workforce trends.
- Real-Time Performance Monitoring: With automated data updates, HR professionals can instantly track KPI performance and identify potential gaps.
- Data-Driven Decision Making: Organizations can make informed decisions about leadership succession, employee training, and career development based on factual insights.
- Customizable and Scalable: The dashboard can be tailored to fit different industries and organizational needs.
- Trend Analysis with Visualizations: Graphs and conditional formatting make it easy to spot performance trends and talent gaps.
Best Practices for Succession Planning KPI Dashboard
- Define Clear KPIs: Ensure that each KPI is well-defined, measurable, and aligned with business goals.
- Regular Data Updates: Input actual performance numbers and targets monthly to maintain accuracy.
- Set Realistic Targets: Use previous year’s data to set achievable yet ambitious goals for succession planning.
- Monitor KPI Trends: Analyze historical trends to predict future workforce requirements.
- Leverage Conditional Formatting: Highlight critical insights with colors, arrows, and data bars to make trends easily identifiable.
- Use Interactive Features: Utilize drop-down lists and automated charts for seamless navigation and analysis.
Conclusion
The Succession Planning KPI Dashboard in Excel is an essential tool for HR professionals, helping them track and manage leadership transitions effectively. By utilizing this dynamic dashboard, organizations can stay ahead of workforce challenges, retain top talent, and ensure long-term business continuity.
Frequently Asked Questions (FAQs)
What are Succession Planning KPIs?
Succession Planning KPIs are key metrics that measure an organization’s ability to identify, develop, and retain leadership talent. Examples include Leadership Readiness, Internal Promotion Rate, and Workforce Stability Index.
Why is a Succession Planning KPI Dashboard Important?
A Succession Planning KPI Dashboard helps organizations track leadership development, identify skill gaps, and ensure a seamless transition in case of workforce changes.
Can this dashboard be customized for my organization’s needs?
Yes! This Excel-based dashboard is fully customizable, allowing organizations to add or modify KPIs based on their unique requirements.
How often should I update the KPI dashboard?
It is recommended to update the dashboard monthly to ensure accurate reporting and better workforce planning.
Click to buy Succession Planning
Visit our YouTube channel to learn step-by-step video tutorials
View this post on Instagram
Click to buy Succession Planning