Cybersecurity remains one of the top priorities for businesses today. With increasing threats and evolving risks, organizations need a clear way to track and manage their cybersecurity performance. In this article, we explore a powerful tool—a Cybersecurity Risk Assessment KPI Dashboard built in Excel. We explain its features, guide you through its setup, and offer actionable best practices to help you monitor and reduce cybersecurity risks. Moreover, we break down how each worksheet contributes to a comprehensive view of your cybersecurity metrics, ensuring you can make informed decisions.
In addition, you will learn about the advantages of using an Excel-based KPI dashboard and discover expert tips for customizing the tool to meet your organization’s unique needs. We also discuss key performance indicators (KPIs) specific to cybersecurity, which help you measure effectiveness, track progress, and ultimately safeguard your digital assets. Whether you are an IT professional, a business leader, or a cybersecurity specialist, this guide offers a step-by-step approach to enhance your risk management efforts using Excel.
Let’s dive into the components and benefits of this dynamic dashboard and see how it can empower you to maintain a robust cybersecurity posture.
Click to buy Cybersecurity Risk Assessment
Understanding the Cybersecurity Risk Assessment KPI Dashboard
A KPI dashboard is a visual management tool that displays key performance indicators in a clear, concise format. This specific Cybersecurity Risk Assessment KPI Dashboard uses Excel to provide a real-time view of essential cybersecurity metrics. You track actual numbers, compare them against targets, and analyze trends over time—all within one integrated workbook.
This dashboard focuses on cybersecurity risk assessment and incorporates KPIs that measure areas like incident response, vulnerability management, and overall risk exposure. You get an interactive experience, where you can switch between monthly, year-to-date (YTD), and month-to-date (MTD) data, enabling you to identify trends quickly and take action.
Furthermore, this dashboard simplifies complex cybersecurity data into easily digestible visuals. It helps you spot areas that need attention and supports data-driven decision-making. In addition, the dashboard employs conditional formatting, which immediately flags performance gaps with clear up and down arrows. Therefore, you can promptly address deviations from your cybersecurity targets.
Click to buy Cybersecurity Risk Assessment
Key Features of the Cybersecurity Risk Assessment KPI Dashboard in Excel
This dashboard offers a robust set of features, and it includes seven worksheets that work together seamlessly. Below, we detail each worksheet and its role in the overall structure:
Home Sheet
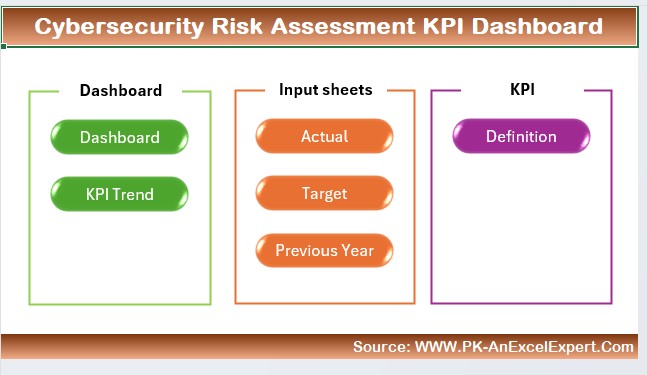
- Purpose: This index sheet acts as your command center.
Features:
- Six navigation buttons allow you to jump directly to any worksheet.
- You enjoy quick access to all parts of the dashboard, saving time and boosting efficiency.
Dashboard Sheet Tab
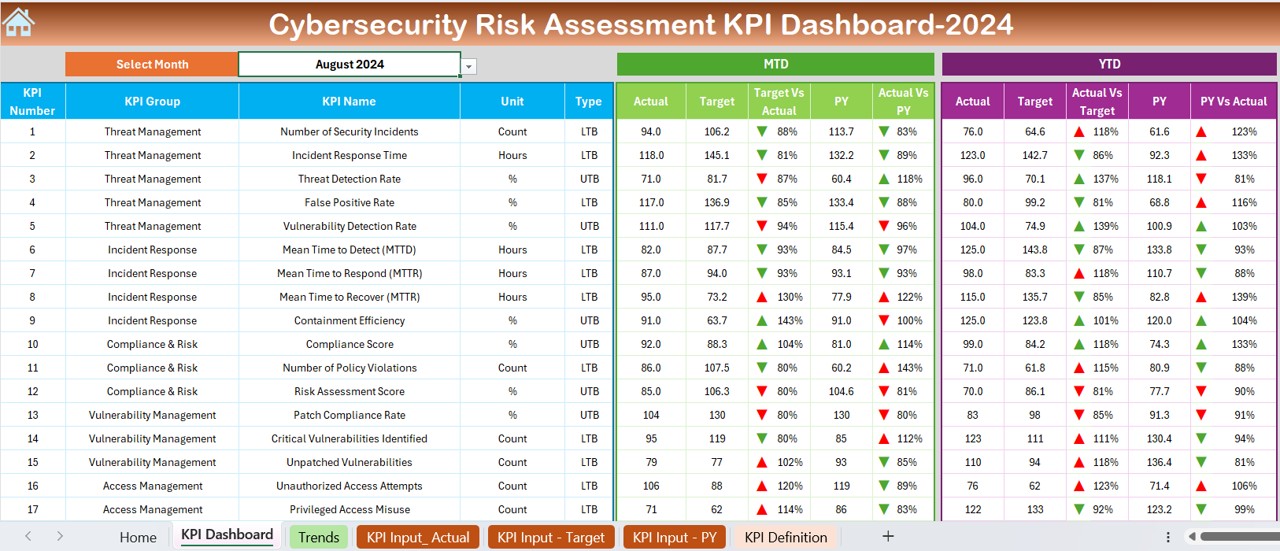
- Purpose: This sheet displays all KPI-related data at a glance.
Features:
- A drop-down menu at cell D3 enables you to select the month, which automatically updates all numbers.
- You see detailed comparisons between MTD Actual, Target, and Previous Year (PY) data.
- The dashboard uses conditional formatting with up and down arrows to indicate performance changes.
- It includes both MTD and YTD figures, so you can track progress over different timeframes.
Click to buy Cybersecurity Risk Assessment
KPI Trend Sheet Tab
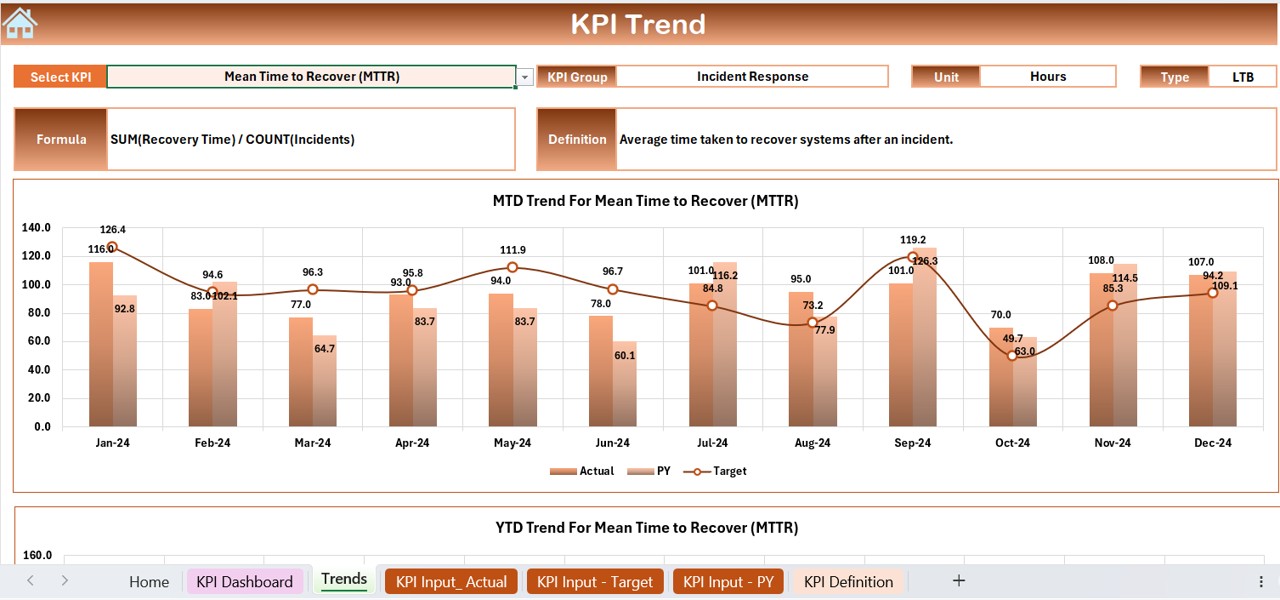
- Purpose: This tab helps you visualize trends for each KPI.
Features:
- A drop-down menu in cell C3 allows you to choose a specific KPI.
- The sheet displays essential details like KPI Group, Unit, Type (e.g., Lower the Better or Upper the Better), Formula, and Definition.
- Trend charts for MTD and YTD Actual, Target, and PY data illustrate progress over time.
Actual Numbers Input Sheet
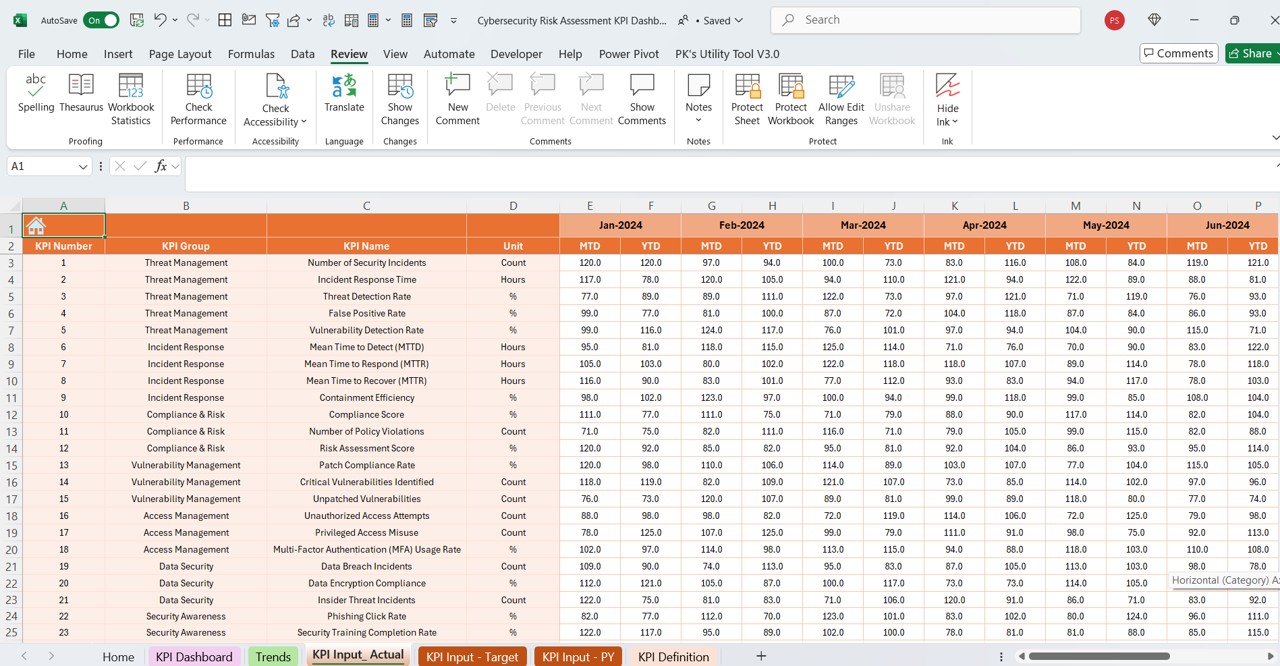
- Purpose: Here, you input actual numbers for MTD and YTD for each month.
Features:
- You change the month by updating cell E1 with the first month of the year.
- This sheet ensures that your real-time data is always current, which supports accurate tracking.
Click to buy Cybersecurity Risk Assessment
Target Sheet Tab
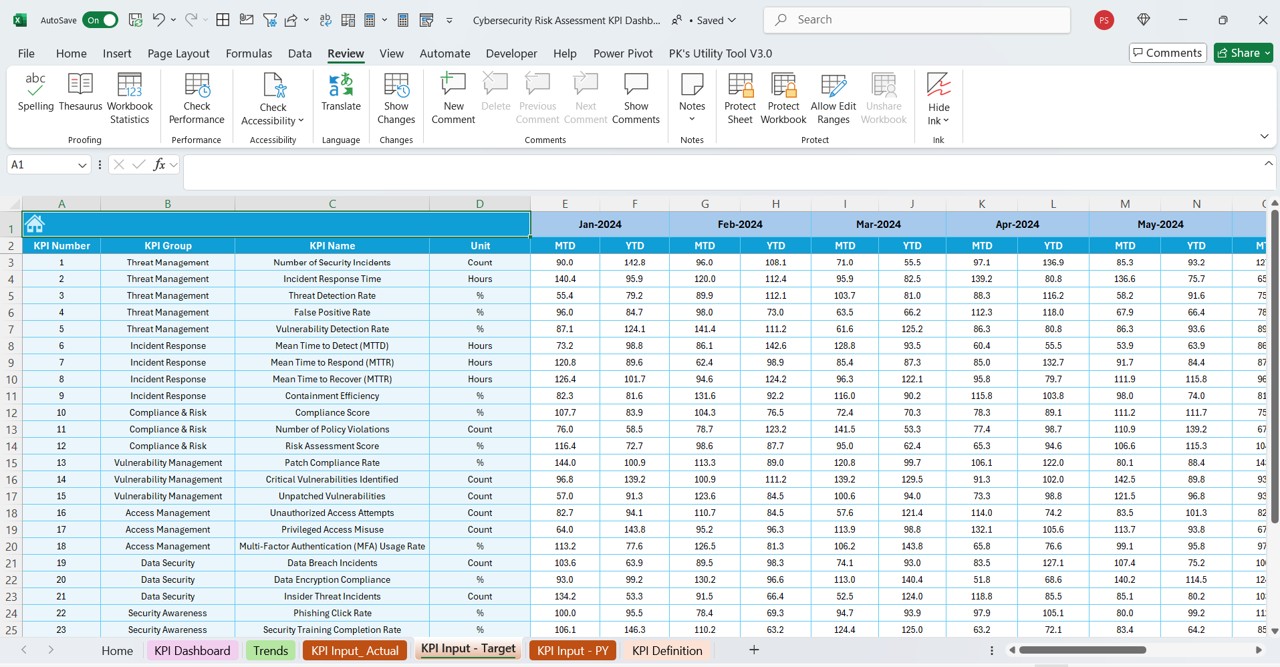
- Purpose: This sheet captures your monthly and YTD target numbers.
Features:
- You enter the target figures for each KPI, establishing benchmarks for performance.
- By setting clear targets, you create a roadmap for your cybersecurity risk management efforts.
Previous Year Number Sheet Tab
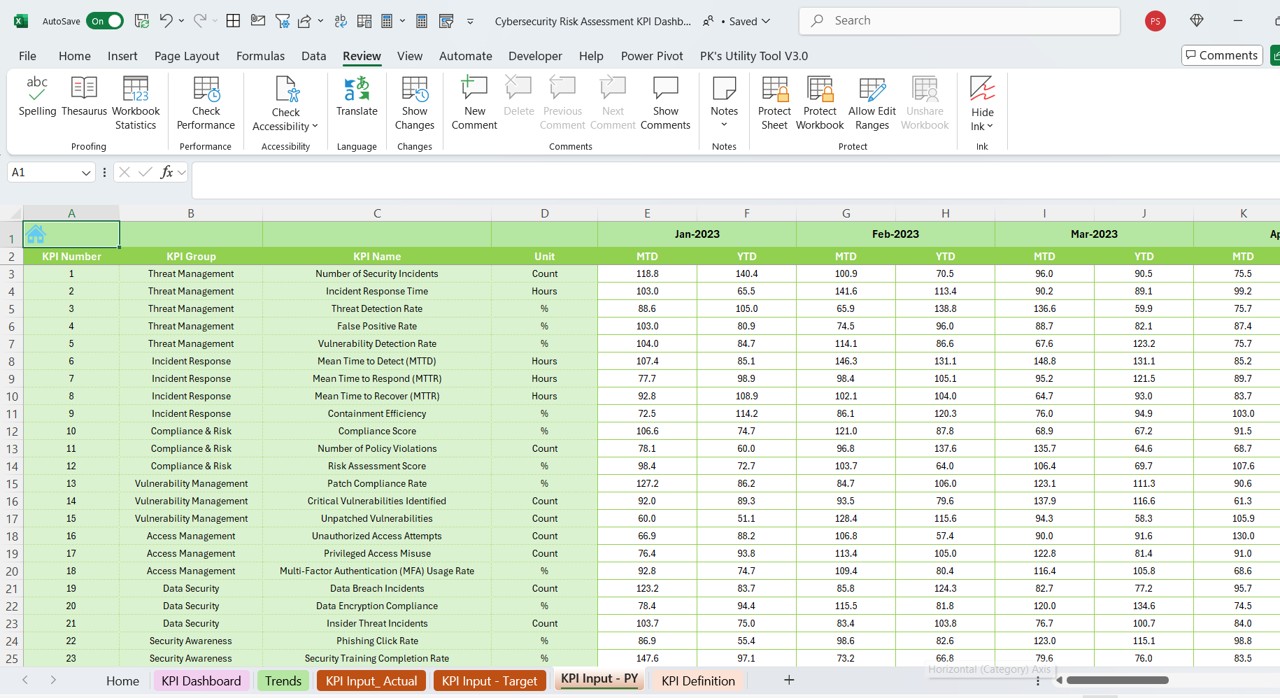
- Purpose: You record last year’s numbers on this sheet.
Features:
- This information helps you make year-over-year comparisons.
- You can assess performance trends and identify areas that have improved or need further attention.
Click to buy Cybersecurity Risk Assessment
KPI Definition Sheet Tab
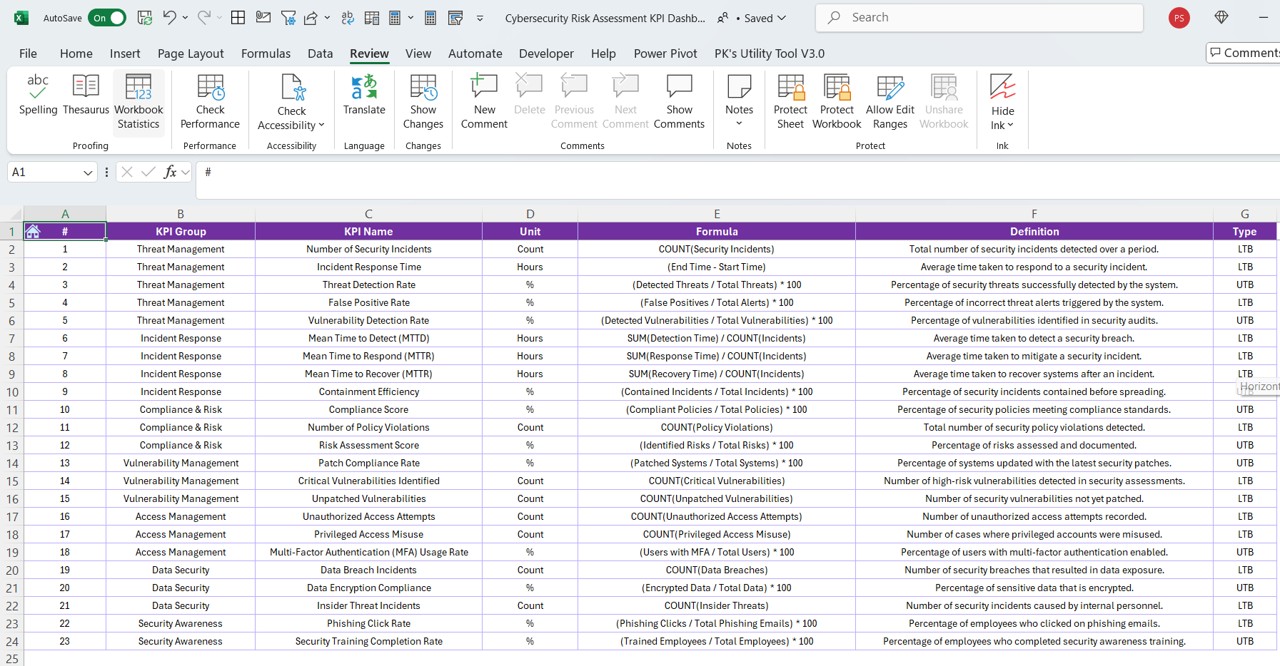
- Purpose: This tab explains each KPI in detail.
Features:
- You define KPI Name, KPI Group, Unit, Formula, and a detailed description.
- This information ensures that everyone in your team understands what each KPI measures and why it matters.
These seven worksheets come together to create a comprehensive tool that simplifies the monitoring of cybersecurity performance. You track, analyze, and act on crucial data with ease, making your risk management efforts more effective.
How to Use the Cybersecurity Risk Assessment KPI Dashboard
Using the dashboard proves simple and efficient. Follow these steps to get the most out of your Excel template:
Step 1: Navigate Using the Home Sheet
- Start Here: Open the Home sheet, which serves as your central index.
- Quick Access: Click on any of the six buttons to move to the respective worksheet. This design helps you avoid unnecessary scrolling and searching.
Step 2: Update Your Dashboard Data
- Select the Month: Go to the Dashboard sheet tab. At cell D3, choose the desired month from the drop-down menu.
- See Instant Changes: The dashboard instantly updates MTD and YTD data, including actual numbers, targets, and previous year figures.
- Visual Indicators: Look for the conditional formatting arrows that help you compare performance changes at a glance.
Step 3: Monitor KPI Trends
- Choose Your KPI: In the KPI Trend sheet tab, use the drop-down menu in cell C3 to select a specific KPI.
- Review Details: The sheet then displays the KPI Group, Unit, Type, Formula, and Definition. In addition, you view trend charts that illustrate both MTD and YTD data for actual, target, and PY figures.
Step 4: Input Your Actual Data
- Enter Numbers: Move to the Actual Numbers Input sheet and input your current MTD and YTD figures.
- Update the Month: Change the month by entering the first month of the year in cell E1. This practice ensures that your dashboard reflects the latest data.
Step 5: Set Your Targets
- Define Benchmarks: Open the Target Sheet tab and enter your monthly and YTD targets for each KPI.
- Plan Ahead: This action helps you establish clear performance benchmarks and work towards meeting or exceeding them.
Step 6: Compare with Previous Year Data
- Historical Insight: In the Previous Year Number sheet tab, enter the previous year’s numbers.
- Analyze Trends: Compare these numbers with current performance to identify improvement areas and potential risks.
Step 7: Understand Your KPIs
- Review Definitions: Finally, go to the KPI Definition sheet tab and ensure you understand each KPI’s meaning.
- Stay Aligned: Knowing the definition, formula, and relevance of each KPI helps you maintain focus on critical cybersecurity risk factors.
By following these steps, you streamline the process of tracking cybersecurity performance. You also create a routine that ensures all data stays up to date, which enhances your overall risk management strategy.
Click to buy Cybersecurity Risk Assessment
Advantages of the Cybersecurity Risk Assessment KPI Dashboard in Excel
Using this Excel dashboard provides several benefits that can transform how you manage cybersecurity risks. Here are some major advantages:
Ease of Use:
You enjoy a simple interface that requires minimal training. The dashboard’s design lets you access critical data quickly, which saves time and reduces errors.
Comprehensive View:
You track multiple KPIs simultaneously, which gives you a holistic understanding of your cybersecurity performance. This comprehensive view supports better decision-making.
Customization:
You can modify the dashboard to fit your specific needs. Whether you add new KPIs or adjust the layout, you maintain full control over your reporting.
Real-Time Data Updates:
When you update data in the Actual Numbers Input, Target, or Previous Year sheets, the dashboard reflects the changes instantly. This feature ensures you always work with the latest information.
Visual Clarity:
You see clear charts and conditional formatting that highlight performance trends and potential issues. This visual representation makes it easier to spot problems before they escalate.
Cost-Effectiveness:
You use Excel, a tool that is widely available and cost-efficient. You do not need expensive software to get the benefits of advanced data visualization and analysis.
Enhanced Collaboration:
When you share the dashboard with your team, everyone remains aligned on cybersecurity goals. You communicate performance metrics effectively, which boosts team accountability.
In summary, the dashboard empowers you to manage cybersecurity risks proactively. You also improve operational efficiency by having a reliable tool that integrates data from multiple sources.
Best Practices for the Cybersecurity Risk Assessment KPI Dashboard in Excel
To get the most out of your Cybersecurity Risk Assessment KPI Dashboard, follow these best practices:
Regular Data Updates
- Schedule Updates:
- You update your data on a regular basis—preferably weekly or monthly. This routine ensures that you track performance accurately.
- Automate Where Possible:
- You explore automation options in Excel (such as macros) to minimize manual data entry errors.
Ensure Data Accuracy
- Double-Check Inputs:
- You verify the numbers you enter in the Actual Numbers Input, Target, and Previous Year sheets. Accurate data leads to better insights.
- Use Data Validation:
- You apply Excel’s data validation tools to prevent incorrect entries, which helps maintain the dashboard’s integrity.
Customize for Your Organization
- Tailor KPIs:
- You adjust the list of KPIs to match your organization’s cybersecurity objectives. For instance, you might add specific metrics like incident response time or system downtime.
- Modify Visuals:
- You change color schemes and chart types to better suit your reporting style, ensuring that the visuals communicate data effectively.
Use Conditional Formatting Effectively
- Set Clear Rules:
- You configure conditional formatting to highlight key changes in performance. For example, you can set rules to display red arrows when targets are not met.
- Review Regularly:
- You update the conditional formatting rules as your KPIs evolve. This practice keeps the dashboard relevant and informative.
Maintain Documentation
- Document Formulas:
- You write down the formulas used for calculating KPIs. Clear documentation helps your team understand how numbers are derived.
- Provide User Guides:
- You create a simple guide that explains how to navigate and update the dashboard. This step ensures consistency when new team members start using the tool.
- Monitor Trends Over Time
- Track Historical Data:
- You compare current data with previous months and years. This trend analysis helps you spot patterns and forecast potential issues.
- Adjust Strategies:
- You use insights from trend analysis to adjust your cybersecurity strategy. For example, if you see a recurring risk factor, you take proactive measures to mitigate it.
Train Your Team
Click to buy Cybersecurity Risk Assessment
- Offer Training Sessions:
- You conduct regular training sessions to ensure everyone understands how to use the dashboard.
- Encourage Feedback:
- You ask team members for suggestions to improve the dashboard, which can lead to valuable enhancements.
Frequently Asked Questions (FAQs) with Answers
What is a Cybersecurity Risk Assessment KPI Dashboard in Excel?
You use this dashboard as a visual tool that displays key performance indicators related to cybersecurity risk assessment. It allows you to track actual performance, targets, and previous year data using multiple worksheets in Excel.
How do I update the data on the dashboard?
You update the dashboard by entering new figures in the Actual Numbers Input, Target, and Previous Year sheets. Then, you select the desired month on the Dashboard sheet, which automatically updates all relevant data.
What advantages does this dashboard offer?
You enjoy several benefits such as ease of use, comprehensive performance tracking, real-time data updates, cost-effectiveness, and enhanced visual clarity. These advantages help you quickly spot potential cybersecurity risks and respond effectively.
How can I customize the dashboard for my organization?
You can customize the dashboard by adjusting the layout, adding or removing KPIs, modifying charts, and incorporating external data sources. You also update the conditional formatting rules to match your performance indicators.
What best practices should I follow when using this dashboard?
You follow best practices such as regular data updates, ensuring data accuracy, customizing the dashboard for your organization, using conditional formatting effectively, maintaining documentation, monitoring trends over time, and training your team.
Is this dashboard suitable for all types of organizations?
You can use this dashboard across various organizations—from small businesses to large corporations and even government agencies. The flexibility and customization options make it adaptable to different industries and risk management needs.
Click to buy Cybersecurity Risk Assessment
Visit our YouTube channel to learn step-by-step video tutorials
View this post on Instagram