Managing procurement is a key part of any business, but it can sometimes become overwhelming. Whether you’re dealing with multiple suppliers, tracking payments, or calculating costs, keeping everything organized is a challenge. Fortunately, with the Procurement Dashboard in Excel, you can simplify this process significantly. This dashboard is designed to help you monitor essential procurement metrics, track payments, and easily analyze data, making decision-making much more efficient.
In this article, we’ll explore everything you need to know about using the Procurement Dashboard in Excel, from its features to its advantages. We’ll also dive into best practices, potential areas for improvement, and answer some frequently asked questions to ensure you get the most out of this powerful tool.
Click to buy Procurement Dashboard in Excel
What Is a Procurement Dashboard in Excel?
A Procurement Dashboard in Excel is a visual tool that centralizes key procurement data. It allows you to track and manage procurement-related information such as orders, payments, costs, and suppliers. By using Excel’s charts, slicers, and pivot tables, the dashboard simplifies complex data and helps you monitor procurement performance in real-time.
Why Should You Use a Procurement Dashboard?
There are several reasons why businesses should use a Procurement Dashboard in Excel. Here are some of the most important benefits:
- Real-Time Monitoring: You can track all procurement activities instantly, ensuring you’re always up to date.
- Data Visualization: With the use of graphs and charts, the dashboard simplifies complex procurement data, making it easier to understand.
- Better Decision Making: The insights you gain from the dashboard help you make informed decisions based on accurate and up-to-date data.
- Time Efficiency: By tracking payments, orders, and suppliers more efficiently, you save time and reduce the risk of errors.
Key Features of the Procurement Dashboard in Excel
Let’s take a closer look at the essential components of the Procurement Dashboard in Excel. These include several interactive and dynamic features that allow users to track, manage, and analyze procurement data.
Click to buy Procurement Dashboard in Excel
1. Dashboard Sheet Tab
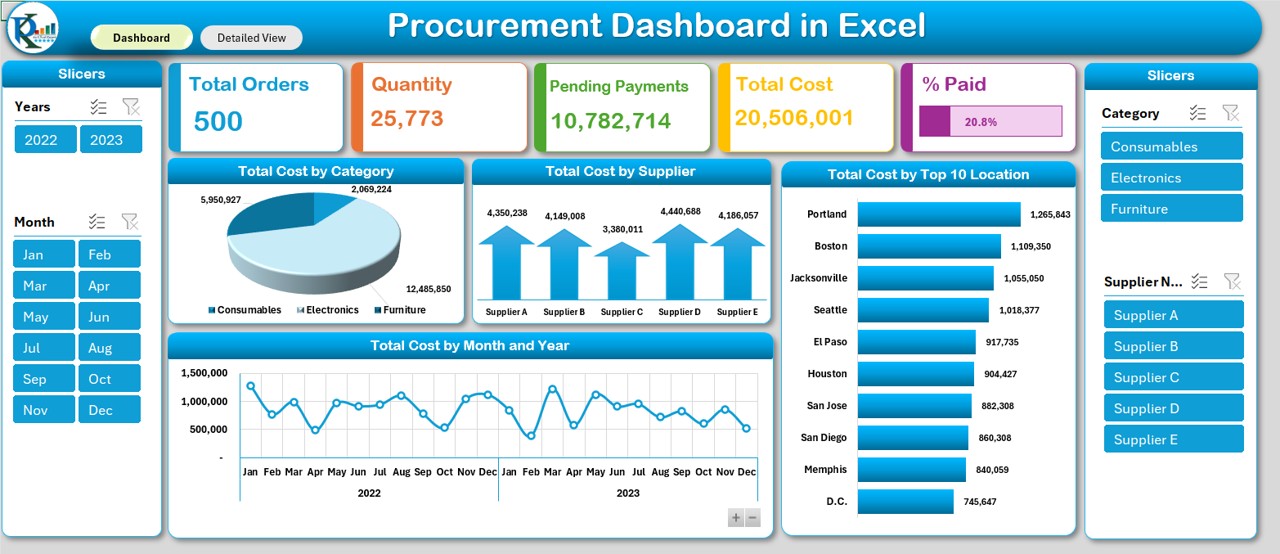
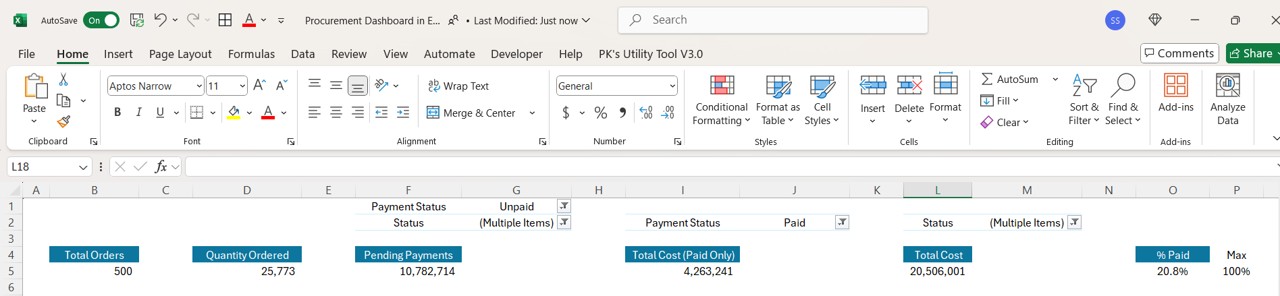
The Dashboard sheet is the main sheet in the Procurement Dashboard. It includes multiple cards, slicers, and charts, all designed to give you a quick and clear overview of your procurement activities.
Cards: These display essential data such as:
- Total Orders
- Quantity Ordered
- Pending Payments
- Total Cost
- Percentage Paid
Slicers: Slicers allow you to filter data by various criteria, such as:
- Year
- Month
- Supplier Name
- Category
Charts: The dashboard features several types of charts that help visualize key data:
- Total Cost by Category (Pie Chart): Displays the breakdown of costs across different procurement categories like consumables, electronics, and furniture.
- Total Cost by Supplier (Arrow Chart): Shows a comparison of total costs across various suppliers.
- Total Cost by Month and Year (Line Chart): Helps you track procurement costs over time, highlighting trends.
- Total Cost by Location (Bar Chart): Displays total procurement costs by location, which can help you identify areas of focus.
Click to buy Procurement Dashboard in Excel
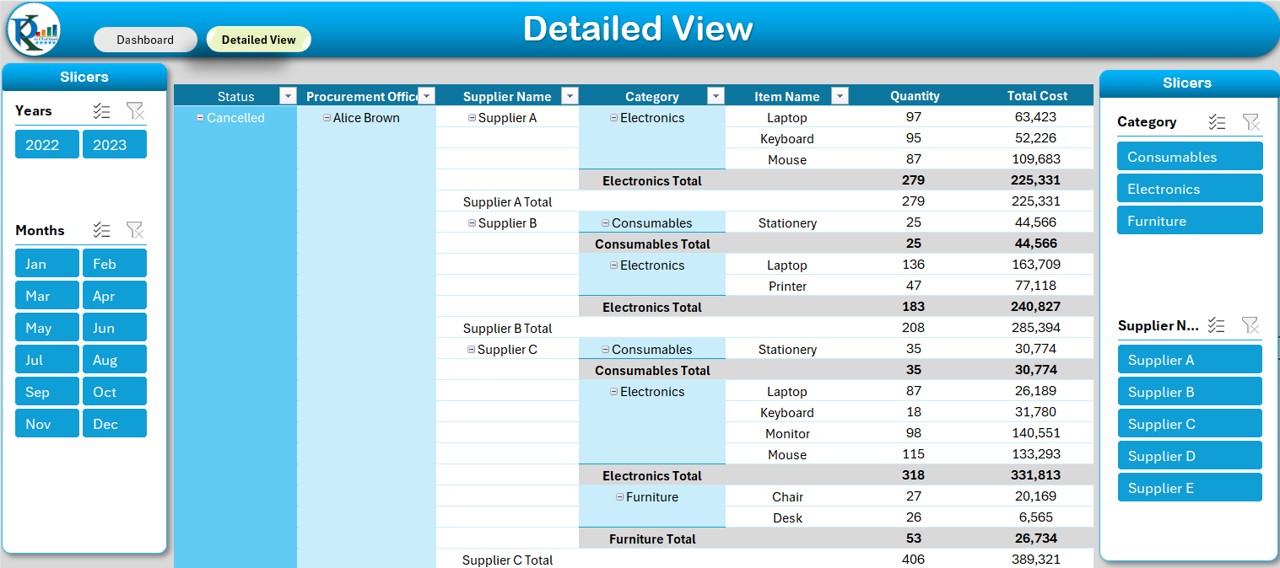
2. Detailed View Sheet Tab
The Detailed View sheet provides a deeper dive into the data. It uses pivot tables to show detailed records, including: – Supplier names – Item names – Quantities – Total costs
This sheet also includes slicers, which allow you to filter the data by supplier, category, or procurement officer.
Click to buy Procurement Dashboard in Excel
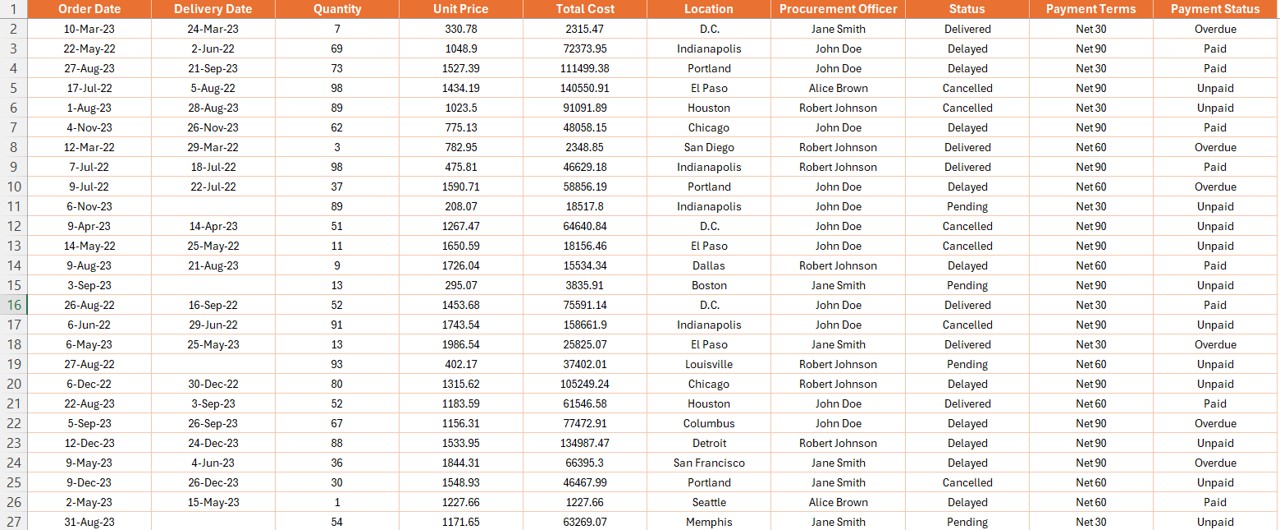
3. Data Sheet Tab
The Data sheet is the foundation of the entire dashboard. It contains all of the raw procurement data that powers the dashboard. This includes: – PO Number – Supplier Name – Item Name – Category – Order Date – Delivery Date – Quantity – Unit Price – Total Cost – Location – Procurement Officer – Status – Payment Terms – Payment Status
By entering and updating this data, you ensure that the dashboard remains accurate and up to date.
Click to buy Procurement Dashboard in Excel
4. Support Sheet Tab
The Support sheet provides additional information to ensure that users understand how to use the dashboard. This might include instructions, tips, and any necessary data validation rules that improve data accuracy.
Click to buy Procurement Dashboard in Excel
Advantages of Using a Procurement Dashboard in Excel
There are several advantages to using a Procurement Dashboard in Excel, including:
- Centralized Data Management: A Procurement Dashboard consolidates all procurement data into one place. This makes it easier for teams to access and manage data, eliminating the need to search through multiple systems or files.
- Easy-to-Understand Data Visualization; The dashboard’s charts and graphs make it easier to interpret complex data. You can quickly spot trends, track supplier performance, and analyze costs in a way that is simple to understand, even for non-technical users.
- Improved Efficiency: With automatic updates and an easy-to-use interface, a Procurement Dashboard increases operational efficiency. It reduces the time needed to generate reports, allowing procurement teams to focus on other tasks.
- Better Supplier Management: The dashboard provides valuable insights into supplier performance, helping you identify which suppliers are offering the best deals and which ones are underperforming. This transparency makes it easier to make better decisions when managing suppliers.
Opportunities for Improvement in Procurement Dashboards
Although a Procurement Dashboard is a powerful tool, there are several opportunities for improvement. Here’s how you can enhance the dashboard to make it even more effective:
- Integrating with Other Systems: Currently, the Procurement Dashboard in Excel works by importing data manually. However, integrating it with other systems such as ERP or inventory management tools would reduce the need for manual updates and ensure the data is more accurate and up to date.
- Adding Automated Alerts: Automated alerts for overdue payments, low inventory, or order delays would make the dashboard even more helpful. These alerts can be triggered based on preset conditions, helping procurement officers stay on top of their tasks.
- Incorporating Advanced Analytics: While Excel provides basic analytical tools, incorporating more advanced functions like predictive analytics would offer deeper insights into procurement trends. This can help businesses forecast demand more accurately and better plan for future procurement needs.
- Optimizing for Mobile Use: Many procurement officers need to access their dashboards while on the go. By optimizing the dashboard for mobile devices, businesses can make it more accessible and improve decision-making in real-time, no matter where they are.
Click to buy Procurement Dashboard in Excel
Best Practices for Using a Procurement Dashboard in Excel
To maximize the effectiveness of your Procurement Dashboard in Excel, consider the following best practices:
- Ensure Data Accuracy: The most important part of any dashboard is the data that drives it. Be sure to enter accurate and consistent data into the Data sheet to ensure the dashboard reflects the true state of your procurement process.
- Regular Updates: Make it a habit to update the dashboard regularly to ensure that it remains useful and relevant. This could mean entering new orders, updating payment statuses, or adjusting costs as needed.
- Train Your Team: Not everyone may be familiar with how to use Excel dashboards. Offering training or providing detailed guides will ensure that everyone in your procurement team is on the same page and can use the dashboard effectively.
- Maintain Data Security: Procurement data is often sensitive, so be sure to implement security measures such as password protection and limiting access to authorized personnel only. This will help prevent unauthorized users from altering or viewing confidential data.
- Keep It Simple: Don’t overwhelm your team with too many features or overly complicated charts. Stick to the most important metrics and keep the design of your dashboard clean and simple for maximum usability.
Frequently Asked Questions (FAQs)
1. How do I create a Procurement Dashboard in Excel?
Creating a Procurement Dashboard involves setting up a Data sheet with all your procurement records, followed by using pivot tables, slicers, and charts to visualize the data. You can then arrange the charts and data into a dashboard layout that’s easy to use.
2. Can I customize the Procurement Dashboard for different industries?
Yes, the Procurement Dashboard can be customized for various industries. Simply adjust the categories and metrics to suit your specific procurement needs, and you’ll have a tailored dashboard for your industry.
3. What types of charts should be used in a Procurement Dashboard?
Common charts used in a Procurement Dashboard include pie charts (for cost distribution), bar charts (for supplier comparisons), line charts (for trend analysis), and arrow charts (for cost analysis across suppliers).
4. Can I track overdue payments with the Procurement Dashboard?
Yes, you can easily track overdue payments by adding payment statuses and using conditional formatting or filters to highlight overdue payments. This makes it easy to stay on top of payments and ensure they are received on time.
5. Is it possible to integrate the Procurement Dashboard with ERP systems?
While Excel doesn’t offer built-in integration with ERP systems, you can import data from your ERP system into Excel manually or use data import functions to automatically update the dashboard.
Click to buy Procurement Dashboard in Excel
Conclusion
The Procurement Dashboard in Excel is a valuable tool that helps procurement teams monitor orders, track payments, and analyze procurement costs more effectively. By using the dashboard, businesses can streamline their procurement processes, improve supplier management, and make better data-driven decisions. With regular updates, accurate data entry, and proper security, this dashboard can significantly enhance your procurement operations.
Visit our YouTube channel to learn step-by-step video tutorials
Watch the step-by-step video tutorial:
Click to buy Procurement Dashboard in Excel