In today’s fast-paced business world, you need powerful tools to track performance and manage incidents efficiently. An Incident Management KPI Dashboard in Excel helps you monitor critical performance indicators in real time. This article explains how to create and use this dashboard to boost your incident management strategy. You will learn how to use each worksheet, explore its advantages, and follow best practices to customize the dashboard according to your organization’s needs. Moreover, you will find answers to frequently asked questions at the end. Let’s dive into this comprehensive guide and empower your incident management processes.
Click to Incident Management
Key Features and Structure of the Dashboard
This template comes with seven interactive worksheets that guide you through every aspect of incident management KPI tracking. Let’s explore each worksheet in detail.
Home Sheet
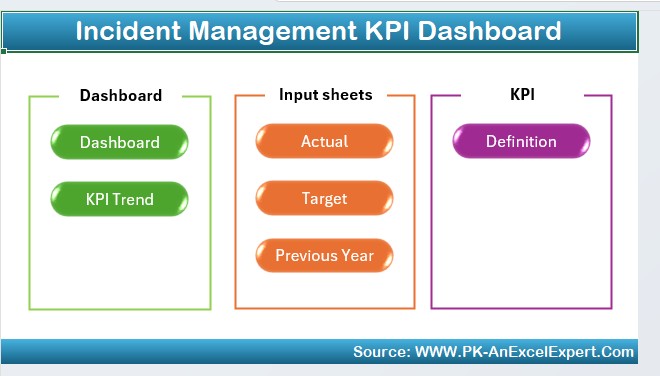
- Purpose: The Home sheet acts as an index.
Features:
- It includes six clickable buttons.
- Each button jumps to a different worksheet within the template.
- It provides an easy-to-navigate interface, so you quickly access various sections.
- The Home sheet ensures that you always know where to find the information you need, thus saving time and reducing confusion.
Dashboard Sheet Tab
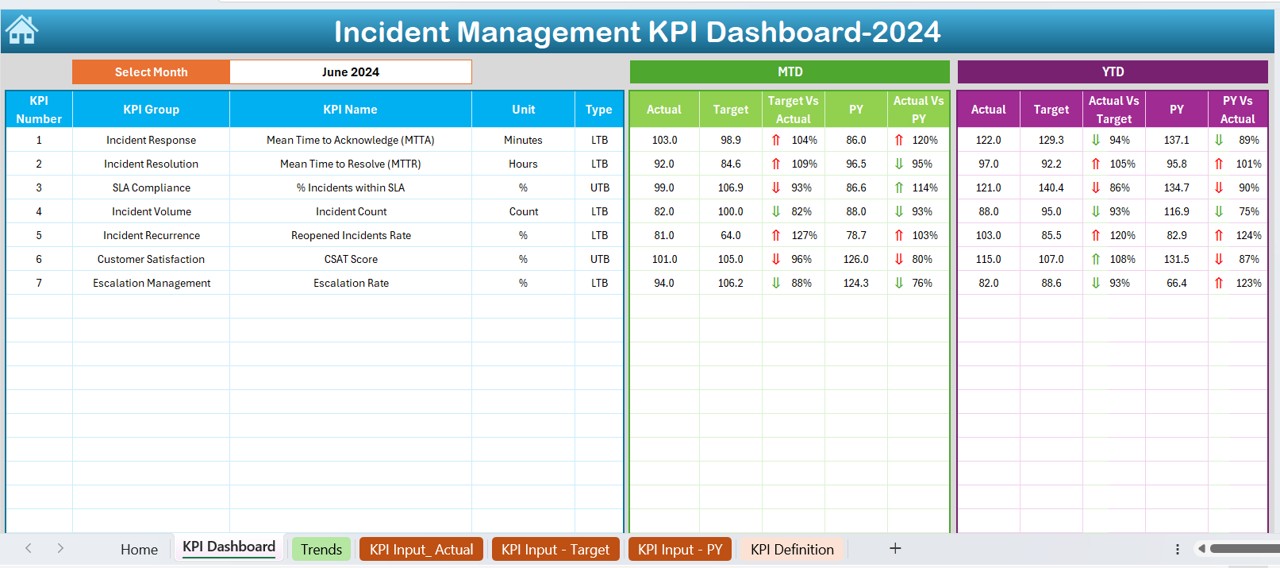
- Purpose: The Dashboard sheet tab serves as the main interface where you view all KPIs.
Key Functionalities:
- Month Selection: At cell D3, you select the month from a drop-down menu. This selection automatically updates the data for the chosen month.
- Data Display: You see the MTD (Month-to-Date) Actual, Target, and Previous Year data.
- Visual Cues: Conditional formatting shows up and down arrows that indicate performance differences. You also find YTD (Year-to-Date) metrics with similar comparisons.
By using this sheet, you quickly understand how current performance aligns with targets and previous results. This live update feature makes the dashboard both interactive and informative.
Click to Incident Management
KPI Trend Sheet Tab
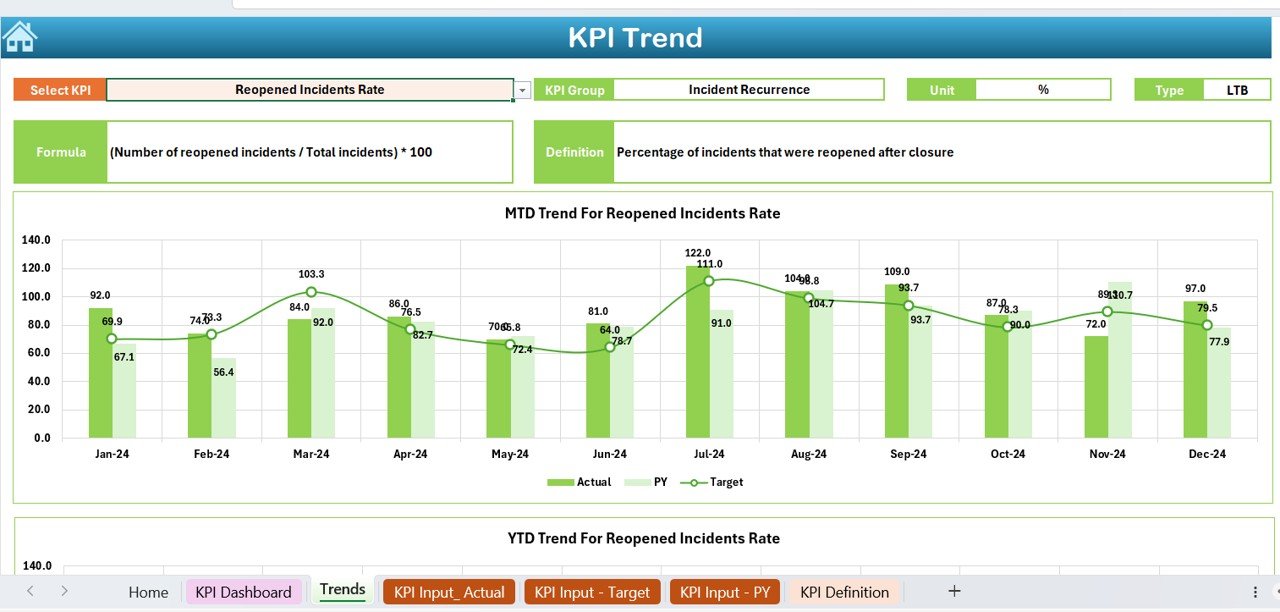
- Purpose: The KPI Trend sheet tab displays detailed trends for each KPI over time.
Key Functionalities:
- KPI Selection: At cell C3, you choose the KPI name from a drop-down list.
- Detailed Information: The sheet shows the KPI Group, Unit, Type (whether lower or higher values indicate better performance), Formula, and a brief Definition.
- Trend Charts: The sheet plots MTD and YTD trend charts for Actual, Target, and Previous Year numbers.
This tab helps you analyze the long-term trends and understand the context behind each KPI. In turn, you use this information to adjust strategies and improve performance over time.
Actual Numbers Input Sheet
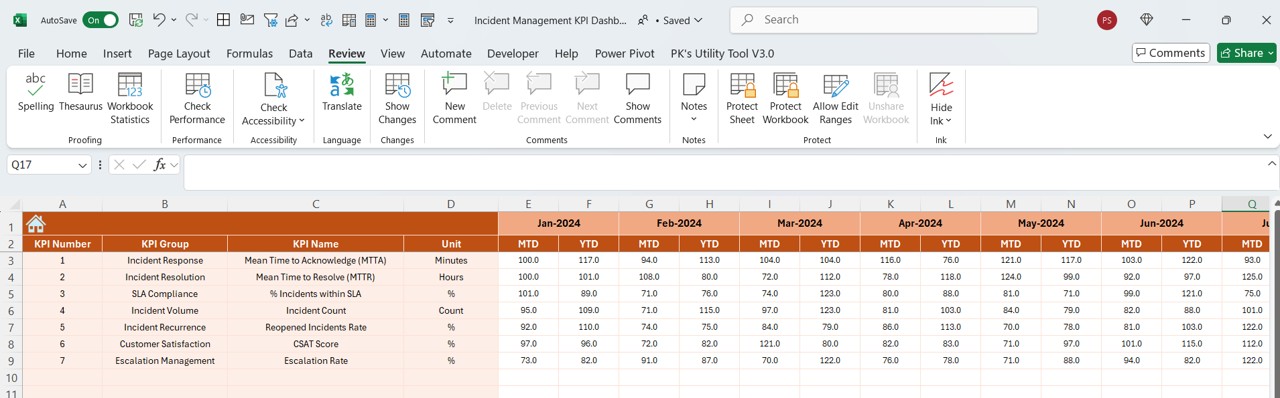
- Purpose: The Actual Numbers Input sheet allows you to enter real-time performance data.
- How It Works:
- Data Entry: You input the actual numbers for both YTD and MTD for each month.
- Month Configuration: At cell E1, you change the month. You start by entering the first month of the year, and then you update the numbers as the year progresses.
This sheet is crucial because it ensures that your dashboard always reflects the most current data. You maintain accuracy by updating the numbers regularly.
Target Sheet Tab
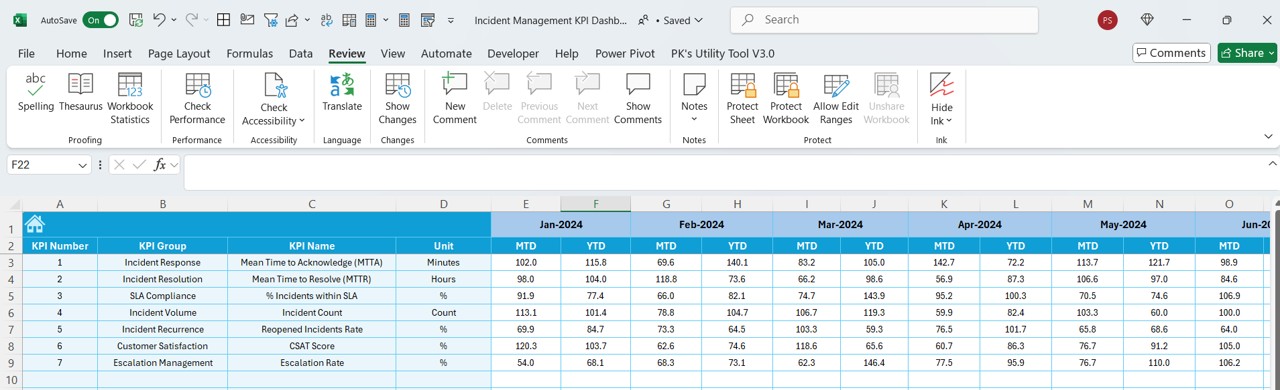
- Purpose: The Target Sheet tab helps you set and review target values.
- How It Works:
- Data Entry: You enter the target numbers for each KPI for both MTD and YTD.
- Goal Setting: The targets you set here guide your performance assessments on the dashboard.
By clearly defining your targets, you create benchmarks that help you measure success and pinpoint areas that need improvement.
Previous Year Number Sheet Tab
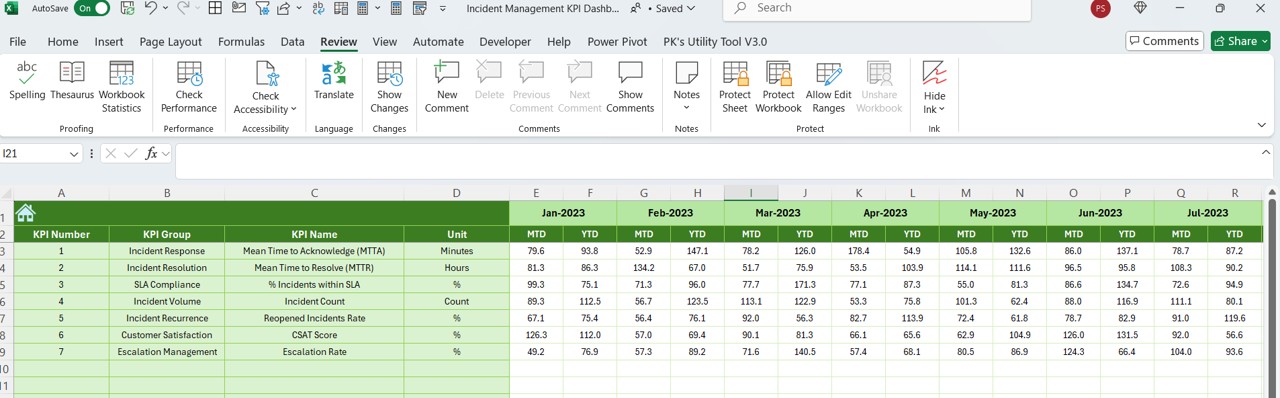
- Purpose: This tab stores the performance numbers from the previous year.
- How It Works:
- Data Entry: You enter last year’s numbers, which align with the current year’s input format.
- Comparison: The dashboard then uses this data to compare current performance against past results.
This sheet enables you to perform year-over-year comparisons easily, offering a historical perspective on performance improvements or declines.
KPI Definition Sheet Tab
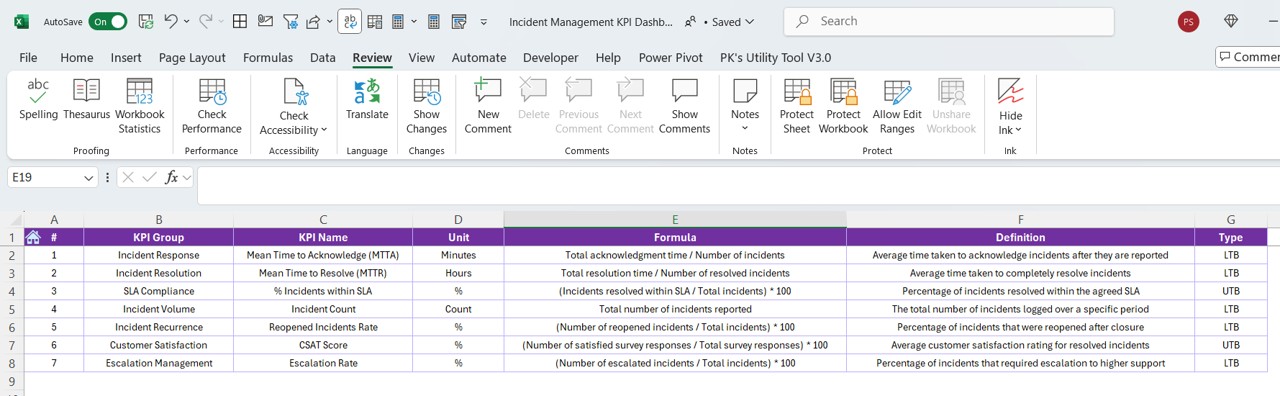
- Purpose: The KPI Definition sheet tab provides detailed explanations of each KPI.
- Key Functionalities:
- Information Fields: You input the KPI Name, KPI Group, Unit of measurement, the formula used to calculate the KPI, and its definition.
- Clarity: This detailed description helps everyone understand the significance and calculation method behind each KPI.
This sheet removes any ambiguity regarding KPI definitions, ensuring that all stakeholders have a common understanding of what each metric represents.
Advantages of the Incident Management KPI Dashboard in Excel
Click to Incident Management
Using an Incident Management KPI Dashboard offers many advantages. Below are some key benefits that you enjoy when you integrate this tool into your processes:
- Centralized Data Tracking: You collect all performance metrics in one place, which makes monitoring easier. This centralization saves time and reduces the risk of errors.
- Real-Time Updates: The dashboard updates numbers based on the selected month. You always see current data, which helps you make quick decisions.
- Visual Clarity: The use of conditional formatting and trend charts provides clear visual cues. You immediately understand whether performance is above or below targets.
- Comparative Analysis: The dashboard compares MTD and YTD actuals against targets and previous year data. You can easily identify trends and anomalies, which supports strategic decision-making.
- User-Friendly Navigation: With the Home sheet and clickable buttons, you quickly jump to relevant sections. This simplicity improves efficiency and makes the tool accessible to all team members.
Customization:
You can easily adapt the dashboard to meet your organization’s needs. Whether you adjust targets or modify KPIs, the template remains flexible.
Best Practices for the Incident Management KPI Dashboard in Excel
To get the most out of your dashboard, follow these best practices. These tips help you maintain accuracy, boost efficiency, and ensure that the dashboard remains an essential tool for your incident management strategy:
Regular Data Updates:
- Update actual numbers and target figures on a regular schedule.
- Ensure that all inputs are accurate and up to date.
Consistent Review Cycles:
- Review the dashboard on a monthly basis.
- Set aside time to analyze trends and performance deviations.
Clear Definitions and Formulas:
- Always refer to the KPI Definition sheet for clarity.
- Confirm that everyone understands how each KPI is calculated.
Leverage Conditional Formatting:
- Use visual cues like up and down arrows to quickly spot performance changes.
- Adjust the formatting rules if necessary to match evolving needs.
Customize for Your Needs:
- Modify the template to include additional KPIs if required.
- Adapt the layout so that it aligns with your incident management workflow.
Training and Support:
- Train your team on how to use the dashboard.
- Provide documentation or short guides that explain each worksheet and feature.
Click to Incident Management
How Does This Dashboard Improve Incident Management?
You enhance incident management by using this KPI dashboard in several ways. First, you monitor incidents in real time, which allows you to act quickly when issues arise. Second, you compare current performance with targets and historical data. This analysis supports proactive decision-making. Moreover, the visual cues and trend charts simplify complex data, ensuring that you always understand the situation.
Q2: How do I update the numbers in the dashboard?
A2: You update the dashboard by entering new data in the Actual Numbers Input sheet and updating target figures in the Target Sheet tab. The dashboard automatically adjusts the data when you select the desired month.
Q3: Can I modify the formulas and conditional formatting?
A3: Yes, you can modify the formulas and conditional formatting rules. This flexibility allows you to customize the dashboard to meet your specific incident management needs.
Q4: Is this template suitable for all types of organizations?
A4: Absolutely. The dashboard template works well for organizations of any size that require incident management tracking. Its customizable nature ensures that you adapt it to your unique requirements.
Q5: What benefits do trend charts offer in this dashboard?
A5: Trend charts provide visual representations of data over time. They help you detect performance trends, compare current results with past data, and make data-driven decisions quickly.
Q6: How often should I review the dashboard for optimal results?
A6: It is best to review the dashboard on a monthly basis. Regular reviews help you identify performance deviations early and adjust strategies accordingly.
Q7: How can this dashboard improve my incident management process?
A7: The dashboard centralizes performance data, enables real-time updates, and simplifies complex data into actionable insights. This process helps you detect issues early and make informed decisions to enhance incident management.
Click to Incident Management
Visit our YouTube channel to learn step-by-step video tutorials
View this post on Instagram