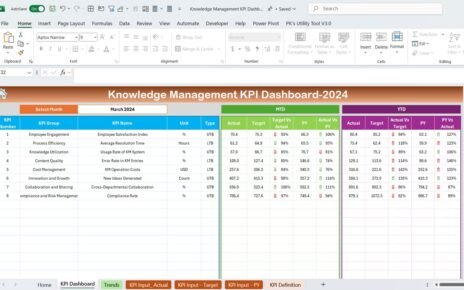
The Onboarding Experience KPI Dashboard is a powerful tool for monitoring and improving the onboarding process of new hires within an organization. It provides a detailed overview of key performance indicators (KPIs) that help HR professionals and managers assess the success of their onboarding programs. With the right set of KPIs, companies can track critical aspects like employee retention, satisfaction, and training completion, ensuring a smoother and more effective onboarding experience.
What is an Onboarding Experience KPI Dashboard?
An Onboarding Experience KPI Dashboard is a visual tool designed to track and manage the most important metrics related to the employee onboarding process. It consolidates data from various sources and presents it in an easy-to-understand format, allowing decision-makers to monitor and optimize their onboarding strategies.
By analyzing KPIs such as employee retention rates, training completion rates, and time to first contribution, companies can identify areas that require improvement, make data-driven decisions, and ensure that new hires integrate successfully into the company.
Key Features of the Onboarding Experience KPI Dashboard
This Onboarding Experience KPI Dashboard comes with several key features that make it an efficient tool for tracking the onboarding process:
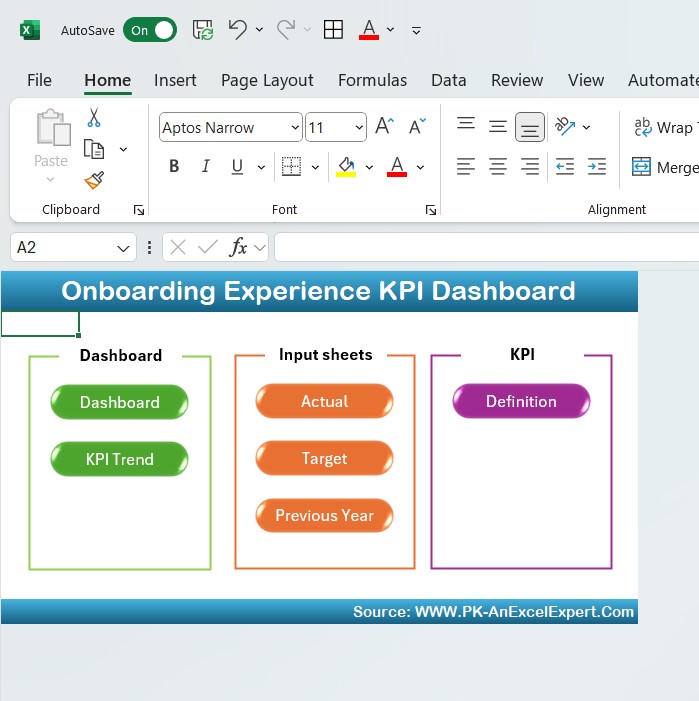
1. Home Sheet
The Home Sheet serves as the index sheet, containing buttons that allow users to navigate easily to other sections of the dashboard. These buttons streamline the process, ensuring that users can quickly access the KPIs, target data, and other key information.
Click to buy Onboarding Experience KPI Dashboard
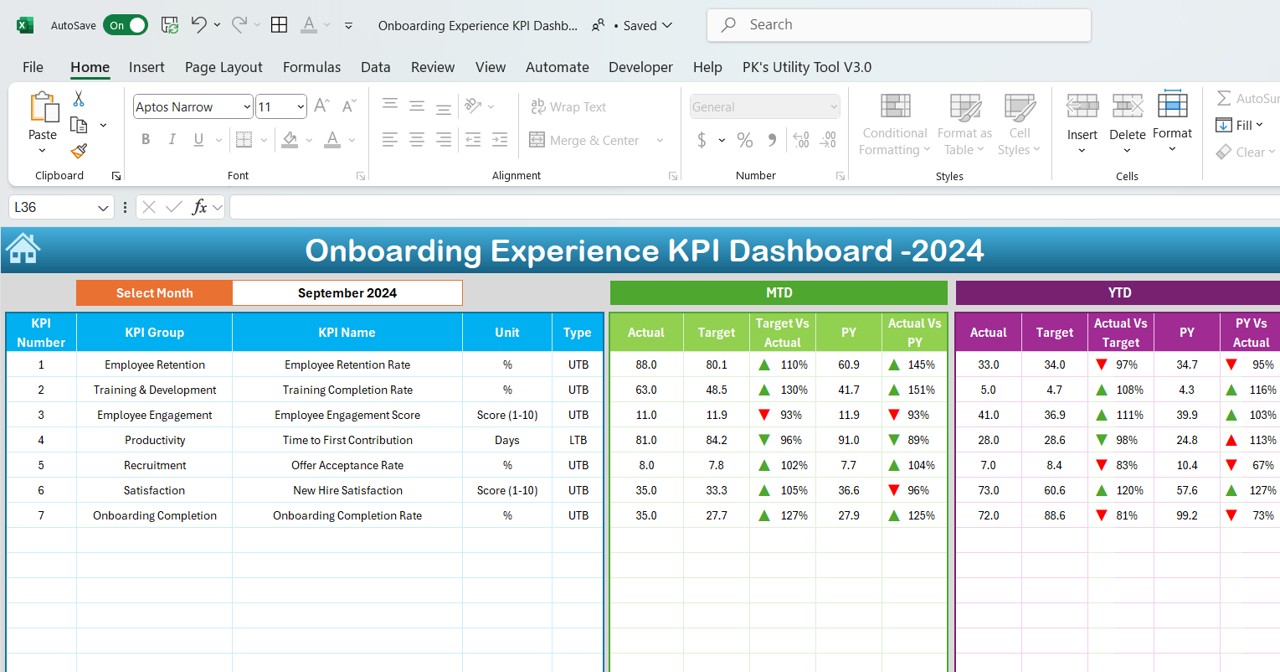
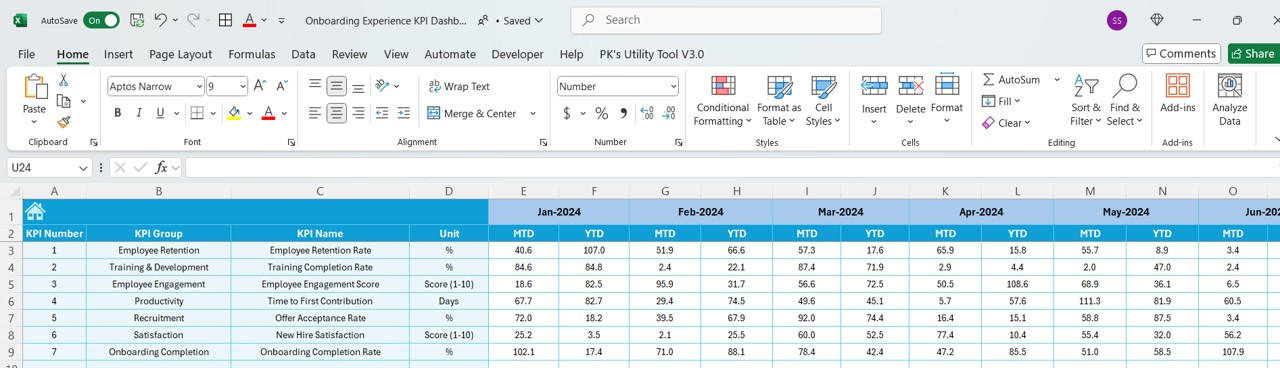
2. Dashboard Sheet Tab
The Dashboard Sheet is the heart of the KPI dashboard. It displays all the important KPI metrics for each month, including:
- MTD (Month-to-Date) Actual data
- Target data
- Previous Year (PY) data
- Target vs Actual comparison
- PY vs Actual comparison
Conditional formatting, including up and down arrows, visually represents performance and progress, making it easier to track trends.
Click to buy Onboarding Experience KPI Dashboard
3. KPI Trend Sheet Tab
The KPI Trend Sheet allows users to select a specific KPI from the dropdown menu. It shows the following details:
- KPI Group
- Unit of the KPI
- KPI Type (Lower the Better or Upper the Better)
- Formula
- Definition
This section provides valuable context about each KPI, helping users understand how they are calculated and interpreted.
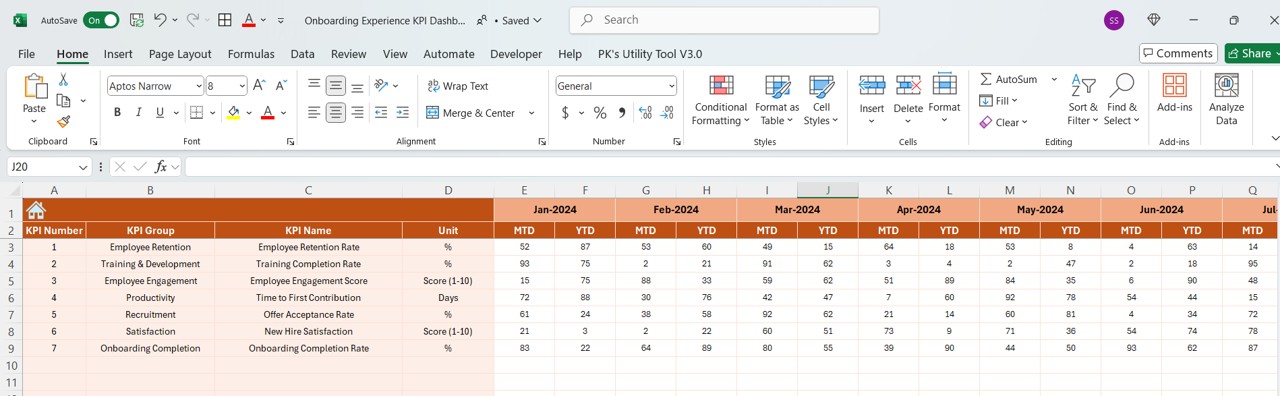
4. Actual Numbers Sheet Tab
In the Actual Numbers Sheet, users can input the actual values for both MTD and YTD for each month. The month can be selected dynamically, allowing users to easily update data for the specific period they are interested in.
Click to buy Onboarding Experience KPI Dashboard
5. Target Sheet Tab
The Target Sheet allows HR professionals to input the target values for each KPI, both for MTD and YTD. Setting targets helps the team understand what is expected and measure progress effectively.
Click to buy Onboarding Experience KPI Dashboard
6. Previous Year Numbers Sheet Tab
This sheet holds data from the previous year, which can be used for comparison against current-year numbers. Analyzing past performance helps identify trends and gaps in the onboarding process.

Click to buy Onboarding Experience KPI Dashboard
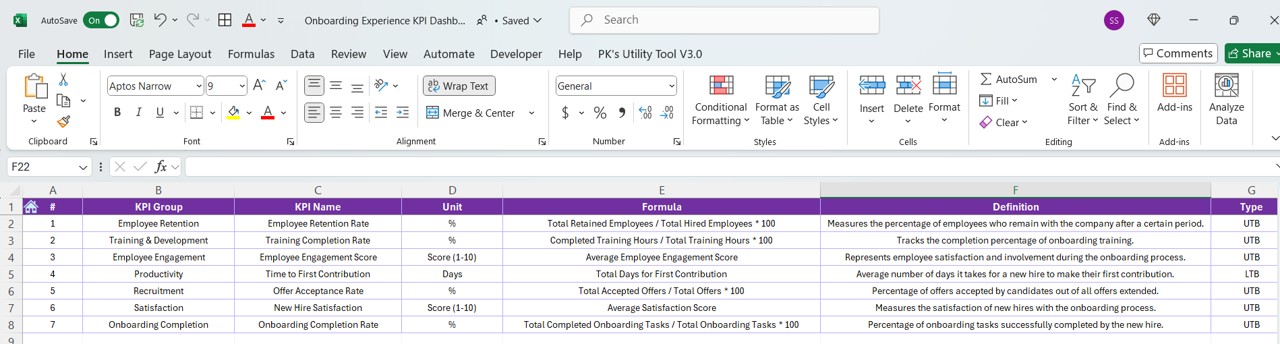
7. KPI Definition Sheet Tab
In the KPI Definition Sheet, users can enter details about each KPI, such as:
- KPI Name
- KPI Group
- Unit
- Formula
- KPI Definition
Click to buy Onboarding Experience KPI Dashboard
This section ensures that all KPIs are clearly defined and that there is a uniform understanding of how each metric is measured.
Advantages of the Onboarding Experience KPI Dashboard
The Onboarding Experience KPI Dashboard offers several key advantages for businesses looking to optimize their onboarding process. Some of the primary benefits include:
- Improved Decision Making: By tracking the most important onboarding metrics, managers can make data-driven decisions that improve the onboarding process. For example, if new hires are not completing training on time, the team can implement additional resources or adjust the training schedule.
- Better Alignment with Business Goals: The dashboard helps align onboarding efforts with the overall goals of the company. By tracking KPIs related to retention, engagement, and performance, businesses can ensure their onboarding programs contribute to long-term success.
- Increased Employee Satisfaction: Tracking satisfaction scores allows companies to identify areas where new hires may be struggling. Early intervention can lead to a better onboarding experience, which in turn can increase employee retention and engagement.
- Time and Resource Efficiency: Instead of manually gathering data from various sources, the dashboard consolidates all the necessary information in one place. This saves time and ensures that HR managers have the data they need at their fingertips.
Opportunities for Improvement in the Onboarding Experience KPI Dashboard
While the Onboarding Experience KPI Dashboard offers numerous advantages, there are always areas where it can be enhanced to drive even greater success. Some opportunities for improvement include:
- Incorporating Employee Feedback: While the dashboard tracks quantitative KPIs, it could be enhanced by incorporating qualitative data from employee feedback surveys. Understanding how employees feel about the onboarding process can provide more context for the numbers.
- Integrating with Other Systems: Integrating the dashboard with other HR systems, such as an applicant tracking system (ATS) or performance management software, could provide a more comprehensive view of the onboarding process. For example, pulling in performance data could help correlate onboarding activities with job performance.
- Real-Time Data Updates: Incorporating real-time data updates into the dashboard can ensure that HR managers have the most up-to-date information available. This can be especially important for tracking time-sensitive metrics like training completion or offer acceptance rates.
- Advanced Predictive Analytics: Adding predictive analytics could help HR professionals forecast future onboarding success. For instance, the dashboard could analyze past data and predict which candidates are most likely to accept offers or stay with the company long-term.
Best Practices for the Onboarding Experience KPI Dashboard
To get the most out of the Onboarding Experience KPI Dashboard, consider implementing the following best practices:
- Set Clear KPIs: Before you begin tracking data, ensure that your KPIs are clear, measurable, and aligned with business objectives. For example, focus on KPIs like employee retention rate and training completion rate to gauge the success of your onboarding efforts.
- Regularly Update Data: Ensure that your team regularly updates the data in the dashboard. Set up monthly reviews to ensure that the data is accurate and up-to-date, allowing for timely intervention if any issues arise.
- Use Conditional Formatting Wisely: Leverage conditional formatting to highlight areas that need attention. Use up and down arrows to indicate positive or negative trends, making it easier for HR professionals to spot potential problems.
- Encourage Cross-Department Collaboration: Onboarding is not just an HR responsibility. Encourage collaboration between HR, hiring managers, and other departments to improve the onboarding experience for new hires. This holistic approach can lead to a smoother transition for new employees.
Click to buy Onboarding Experience KPI Dashboard
Frequently Asked Questions with Answers
1. What is an Onboarding Experience KPI Dashboard?
An Onboarding Experience KPI Dashboard is a tool used to track key performance indicators (KPIs) related to the onboarding process, such as employee retention, training completion, and time to first contribution.
2. What KPIs are typically tracked in an Onboarding Experience KPI Dashboard?
Some common KPIs tracked in an onboarding dashboard include employee retention rate, training completion rate, employee engagement score, and time to first contribution.
3. How does the Onboarding Experience KPI Dashboard help HR teams?
The dashboard helps HR teams monitor and evaluate the success of their onboarding programs, identify areas for improvement, and make data-driven decisions that enhance the overall onboarding experience.
4. Can the Onboarding Experience KPI Dashboard be customized?
Yes, the dashboard is fully customizable, allowing HR professionals to add or remove KPIs based on the specific needs of their organization.
5. How often should data be updated in the Onboarding Experience KPI Dashboard?
It is recommended to update the data monthly to ensure that the dashboard reflects the most current information about your onboarding processes.
Conclusion
The Onboarding Experience KPI Dashboard is an essential tool for organizations looking to optimize their onboarding process. By tracking key metrics like employee retention, training completion, and satisfaction, businesses can ensure that new hires have a positive and successful experience. Implementing this dashboard not only improves decision-making but also helps align onboarding efforts with the company’s long-term goals. By following best practices and continuously improving the dashboard, organizations can create an onboarding experience that drives employee satisfaction, retention, and overall success.
Visit our YouTube channel to learn step-by-step video tutorials
Click to buy Onboarding Experience KPI Dashboard