Employee training is a crucial part of any organization’s success. To ensure that training programs are effective, organizations track key performance indicators (KPIs). An Employee Training KPI Dashboard in Excel is a powerful tool that helps businesses monitor, analyze, and improve their employee training programs.
This article will provide a detailed guide on how to use an Employee Training KPI Dashboard in Excel, covering its features, advantages, best practices, and FAQs.
Click to Employee Training
What is an Employee Training KPI Dashboard?
An Employee Training KPI Dashboard is a visual representation of various training performance indicators, helping HR teams and managers measure the effectiveness of training initiatives. It enables tracking of training completion rates, employee progress, competency improvements, and cost efficiency.
Key Features of the Employee Training KPI Dashboard in Excel
This ready-to-use Excel template consists of seven key worksheets, each serving a specific function:
Home Sheet
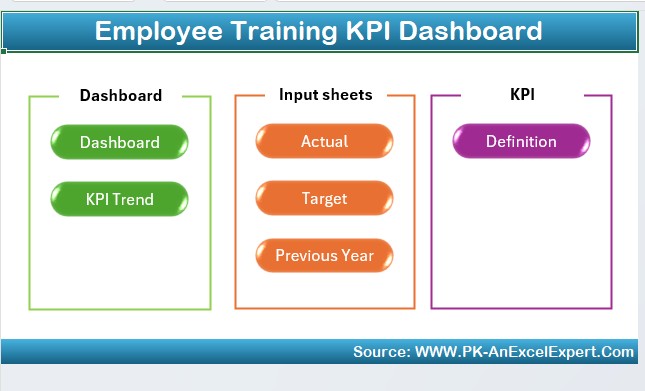
- Acts as the index page.
- Contains six buttons that provide direct access to other sheets for easy navigation.
Dashboard Sheet Tab
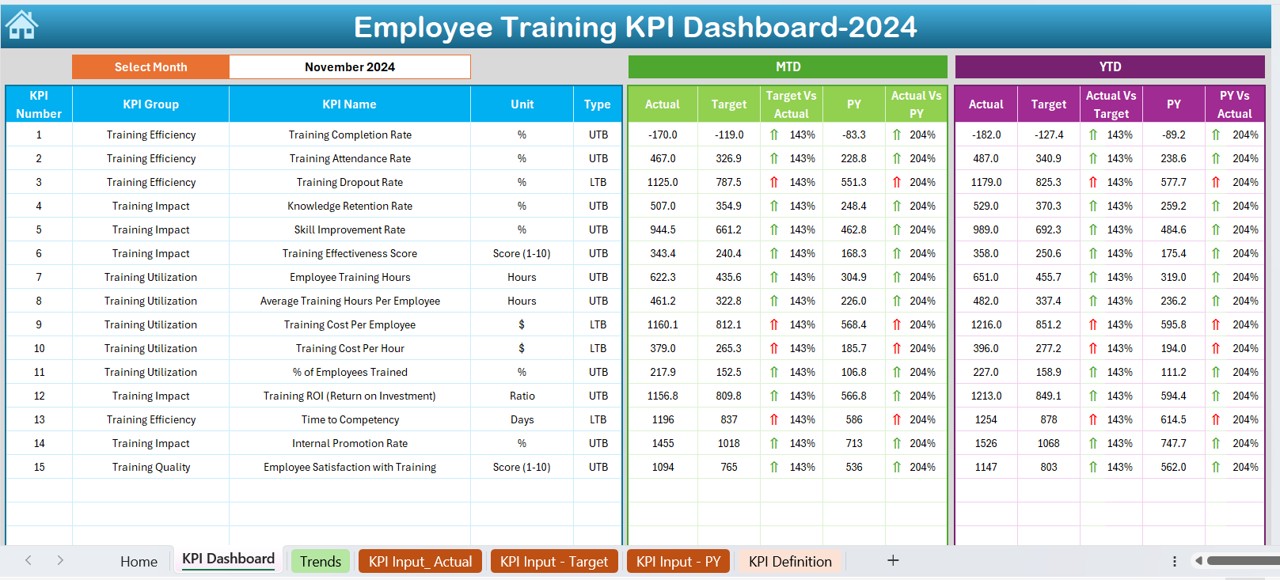
- The main visual representation of all training KPIs.
- Allows users to select the month using a drop-down list (Cell D3), dynamically updating the dashboard.
- Displays MTD (Month-to-Date) and YTD (Year-to-Date) metrics for Actual, Target, and Previous Year.
- Uses conditional formatting with up/down arrows to show performance trends.
Click to Employee Training
KPI Trend Sheet Tab
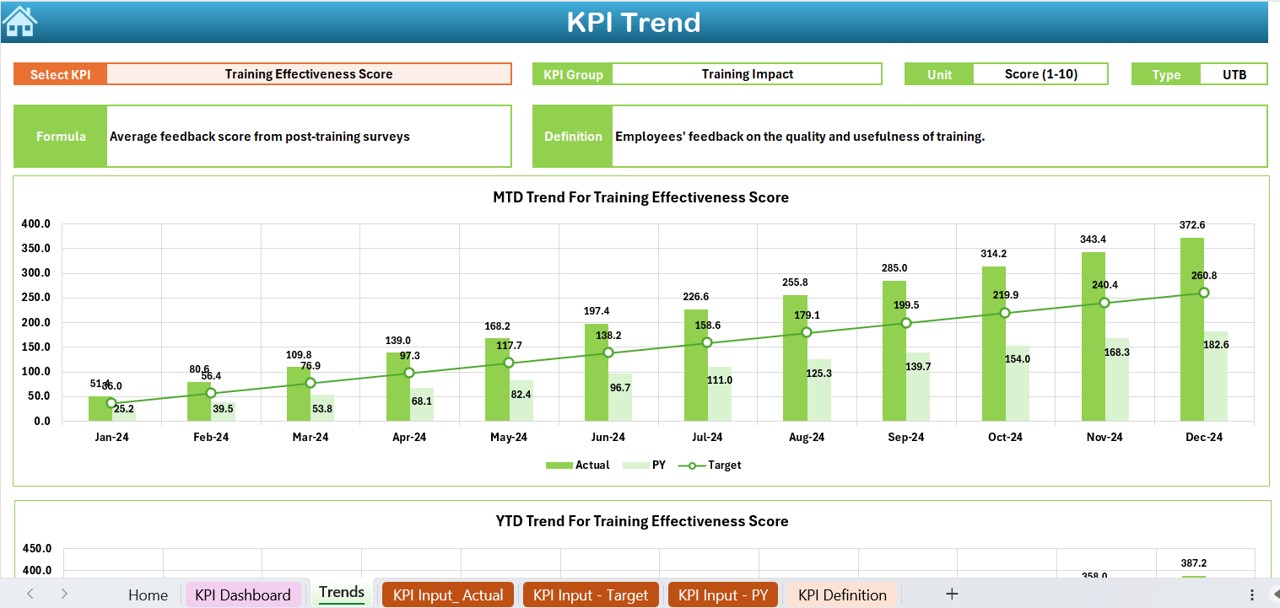
- Provides a detailed analysis of each KPI.
- Allows selection of specific KPI names (Drop-down in C3).
- Displays KPI Group, Unit, Type (Lower is better / Upper is better), Formula, and Definition.
- Contains MTD and YTD trend charts for Actual, Target, and Previous Year.
Actual Numbers Input Sheet
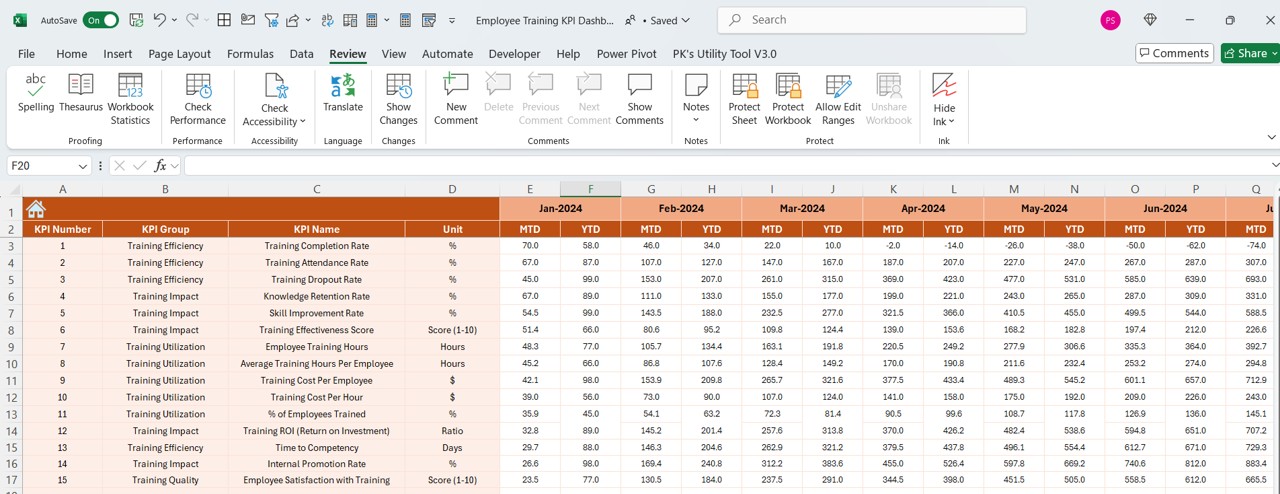
- Users enter actual performance data for both YTD and MTD.
- The month can be updated by entering the first month of the year in E1.
Click to Employee Training
Target Sheet Tab
- Users input the target numbers for each KPI.
- Includes both MTD and YTD target values.
Previous Year Numbers Sheet Tab
- Stores the previous year’s KPI data, similar to the current year’s structure.
- Helps in trend comparison and performance evaluation.
KPI Definition Sheet Tab
- Provides a detailed definition of each KPI.
- Includes KPI Name, Group, Unit, Formula, and Description.
Advantages of Using an Employee Training KPI Dashboard in Excel
- Centralized Training Performance Tracking: The dashboard provides a single view of all KPIs, reducing the hassle of checking multiple reports.
- Real-Time Monitoring and Analysis: Users can instantly track training performance and identify areas that need improvement.
- Data-Driven Decision Making: Provides valuable insights for HR and management teams to optimize training programs.
- Month-to-Month Comparisons: Allows organizations to compare training progress over different months and years.
- Improved Employee Engagement: Helps in identifying skill gaps and ensuring that employees receive relevant training.
- Cost-Efficient Solution: A ready-to-use Excel template eliminates the need for expensive training tracking software.
Best Practices for Using an Employee Training KPI Dashboard
- Define Clear Training KPIs: Establish measurable KPIs such as completion rates, knowledge retention scores, and training ROI.
- Update Data Regularly: Ensure that actual numbers and target values are updated frequently to maintain accuracy.
- Use Conditional Formatting for Better Insights: Highlight key performance trends with color-coded indicators (Green for progress, Leverage Trend Analysis: Utilize the KPI Trend Sheet to analyze training performance over time.
- Align Training Goals with Business Objectives: Ensure that training KPIs support overall company growth and employee skill development.
Conclusion
An Employee Training KPI Dashboard in Excel is an essential tool for tracking and optimizing employee learning programs. With its user-friendly interface, real-time tracking, and data-driven insights, this dashboard enhances training effectiveness and ensures employee growth. Implementing this tool will help HR professionals make informed decisions and continuously improve training outcomes.
Frequently Asked Questions (FAQs)
What are the most important KPIs to track in an Employee Training Dashboard?
- Some of the key training KPIs include:
- Training Completion Rate
- Employee Knowledge Retention
- Training ROI (Return on Investment)
- Time Spent on Training
- Employee Feedback and Satisfaction
How often should I update the Employee Training KPI Dashboard?
It is recommended to update the dashboard monthly to ensure accurate tracking and trend analysis.
Can I customize the KPI Dashboard for specific training programs?
Yes! This Excel template is fully customizable. You can add, remove, or modify KPIs to fit your organization’s training needs.
Does this dashboard work for small businesses?
Absolutely! Whether you have a small team or a large workforce, this scalable dashboard can efficiently track training KPIs.
How can I improve training performance using this dashboard?
By analyzing MTD and YTD trends, organizations can identify underperforming areas and take corrective actions to enhance training effectiveness.
Click to Employee Training
Visit our YouTube channel to learn step-by-step video tutorials
View this post on Instagram