Managing expenses efficiently is crucial for the financial health of any organization, especially in industries like construction, retail, healthcare, and more. One of the most effective tools to track, analyze, and optimize expenses is a well-structured Expense Management KPI Dashboard. This tool allows businesses to monitor key metrics related to their expenses, enabling informed decision-making and better control over financial resources.
In this article, we’ll dive deep into the Expense Management KPI Dashboard, explore its key features, and provide a complete breakdown of all the KPIs involved. By the end of this guide, you’ll not only understand the components of the dashboard but also be able to leverage it to enhance your organization’s expense management practices.
What is an Expense Management KPI Dashboard?
An Expense Management KPI Dashboard is a visual tool that presents key performance indicators (KPIs) to track, monitor, and manage an organization’s expenses. It is a critical component for businesses aiming to improve their financial efficiency, reduce costs, and ensure profitability.
Why Use an Expense Management KPI Dashboard?
A well-designed Expense Management KPI Dashboard helps organizations:
- Track spending across various departments or categories.
- Compare actual expenses to budgeted or targeted expenses.
- Identify trends in spending, helping to anticipate future needs.
- Highlight areas for improvement in cost efficiency.
- Make informed decisions on reducing unnecessary expenses and reallocating resources effectively.
Now, let’s take a closer look at the components that make up a typical Expense Management KPI Dashboard.
Key Features of an Expense Management KPI Dashboard
The Expense Management KPI Dashboard is structured with 7 worksheets, each designed to manage different aspects of your expense data. Below are the key features:
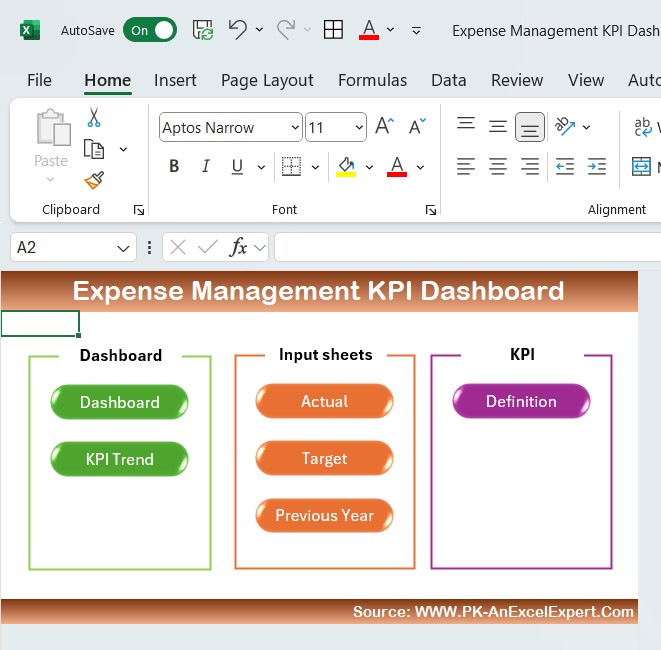
1. Home Sheet
The Home Sheet serves as the index for your dashboard. It includes six buttons that help you navigate to the respective sheets. This sheet makes it easy to access all the essential sections of the dashboard.
Click to buy Expense Management KPI Dashboard in Excel
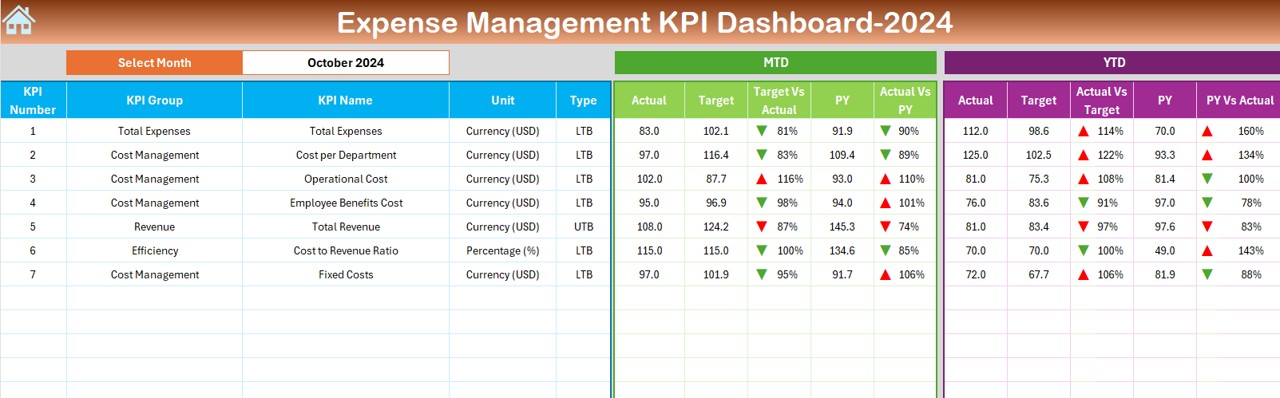
2. Dashboard Sheet Tab
This is the main sheet where all your KPIs are displayed. Here, you can select the month from the dropdown menu, and the entire dashboard will update to show the corresponding data for that month. The Dashboard Sheet presents:
- MTD (Month-to-Date) actuals, targets, and comparisons to previous year (PY) data.
- YTD (Year-to-Date) actuals, targets, and comparisons to PY data.
- Conditional formatting arrows are used to show the performance (up or down).
Click to buy Expense Management KPI Dashboard in Excel
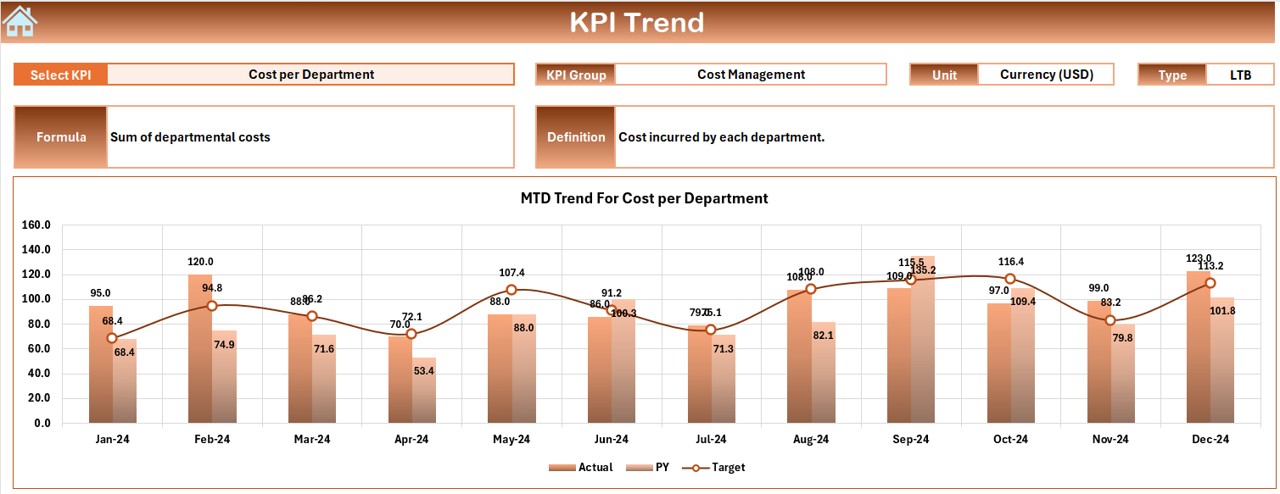
3. KPI Trend Sheet Tab
The KPI Trend Sheet allows you to select a specific KPI from the dropdown. It displays:
- KPI Group
- Unit of KPI
- Type of KPI (Lower the better or Upper the better)
- Formula of KPI
- Definition of the KPI
Click to buy Expense Management KPI Dashboard in Excel
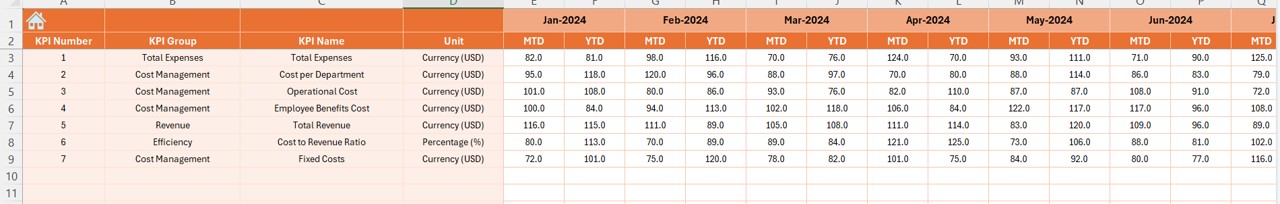
4. Actual Number Sheet Tab
This sheet allows you to enter the actual numbers for YTD and MTD for each month. It gives you the flexibility to change the month and track the performance of your expenses.
Click to buy Expense Management KPI Dashboard in Excel
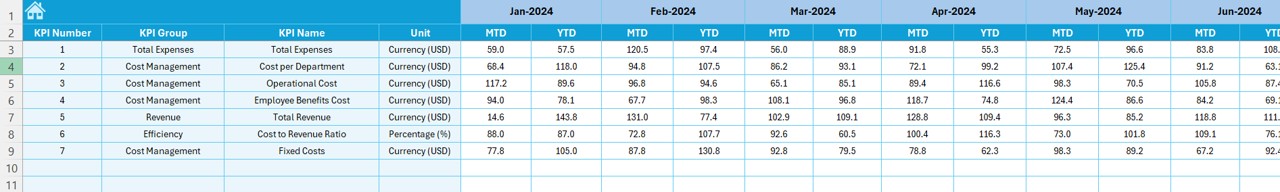
5. Target Sheet Tab
The Target Sheet is where you enter the target values for each KPI for both MTD and YTD. This helps you compare actual performance against the set targets.
Click to buy Expense Management KPI Dashboard in Excel
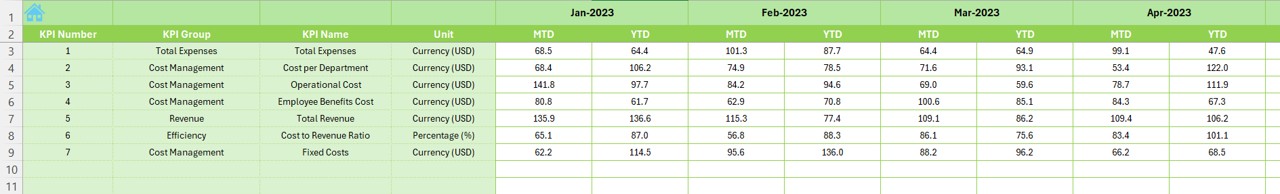
6. Previous Year Number Sheet Tab
This sheet stores data from the previous year, allowing you to compare current data with historical performance.
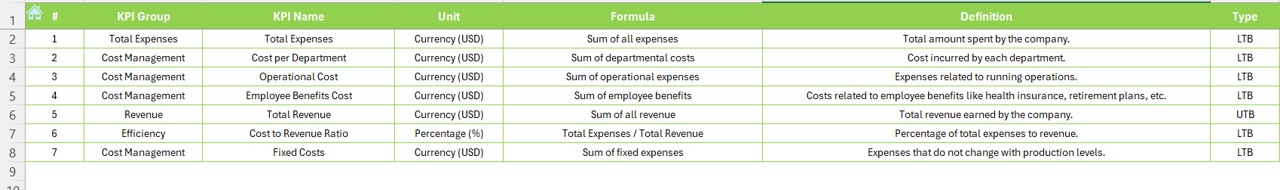
7. KPI Definition Sheet Tab
The KPI Definition Sheet contains the details for each KPI, including:
- KPI Name
- KPI Group
- Unit
- Formula
- Definition
Click to buy Expense Management KPI Dashboard in Excel
Advantages of Using an Expense Management KPI Dashboard
An Expense Management KPI Dashboard provides several advantages, making it an indispensable tool for modern businesses:
- Better Decision-Making
With real-time data and visual insights, the dashboard helps managers make informed decisions on where to cut costs and how to optimize spending.
- Improved Budgeting
By comparing actual expenses to targets and previous year data, the dashboard allows for more accurate forecasting and budget adjustments.
- Enhanced Financial Control
Tracking KPIs such as cost per department, operational costs, and fixed costs gives businesses full control over their finances.
- Increased Accountability
Having a clear visual representation of KPIs allows departments to track their own expenses and be held accountable for them.
- Time-Saving
Automation of data tracking and report generation saves time, allowing employees to focus on strategic activities rather than manual data collection.
Opportunities for Improvement in Expense Management KPI Dashboard
While the Expense Management KPI Dashboard is a powerful tool, there are always opportunities for improvement:
-
Integration with Other Financial Systems: Integrating the dashboard with other enterprise resource planning (ERP) or accounting systems can automate data flow, reducing manual input and errors.
-
Customization of KPIs: Allow users to add their own KPIs based on specific business needs, such as marketing spend or IT costs, for more personalized financial analysis.
-
Real-Time Updates: Using cloud-based platforms to provide real-time data updates can ensure that the dashboard always reflects the latest financial information.
Best Practices for Managing an Expense Management KPI Dashboard
To get the most out of your Expense Management KPI Dashboard, here are some best practices to follow:
- Regularly Update Data
Ensure that actual expenses, targets, and previous year data are regularly updated to reflect the current financial landscape.
- Set Realistic Targets
When entering target values for each KPI, make sure they are achievable based on historical data and current market conditions.
- Use Conditional Formatting
Leverage the power of conditional formatting to highlight key metrics, such as budget variances and KPI performance, for easy identification.
- Review KPIs Periodically
KPIs should be reviewed regularly to ensure they align with organizational goals and to adjust them if necessary.
- Train Your Team
Ensure that team members understand how to use the dashboard effectively and interpret the data it provides for better decision-making.
Conclusion
An Expense Management KPI Dashboard is an invaluable tool for businesses looking to streamline their expense tracking and management. By leveraging the KPIs outlined in this article and following best practices, organizations can improve financial transparency, optimize spending, and ultimately achieve better financial health.
Frequently Asked Questions (FAQs)
1. What is the importance of tracking expenses with KPIs?
Tracking expenses with KPIs helps businesses monitor their spending, compare actual expenses with targets, and identify areas for cost-saving, all of which are critical for maintaining financial stability.
2. How do I set realistic targets for KPIs in my dashboard?
Realistic targets should be set based on historical data, industry benchmarks, and current financial conditions. It’s essential to keep the targets achievable but challenging enough to motivate improvements.
3. What tools can I use to create an Expense Management KPI Dashboard?
There are several tools available, such as Microsoft Excel, Google Sheets, and Power BI, that can be used to create an interactive and visually appealing KPI dashboard.
4. How often should I update the data in the KPI dashboard?
Ideally, you should update the data on a monthly or quarterly basis, depending on the frequency of your expense tracking and the type of business you operate.
5. Can I customize KPIs in the dashboard?
Yes, you can customize the KPIs to reflect your business’s specific financial metrics. This ensures the dashboard provides the most relevant and insightful data for your organization.
Visit our YouTube channel to learn step-by-step video tutorials
View this post on Instagram
Click to buy Expense Management KPI Dashboard in Excel