A Cash Flow KPI Dashboard is a powerful tool that helps businesses monitor, manage, and forecast their cash flow more effectively. With real-time data on key performance indicators (KPIs), it enables you to stay on top of your financial situation, allowing you to make informed decisions that ensure the stability and growth of your business. In this comprehensive article, we’ll walk you through the components of a Cash Flow KPI Dashboard, list the essential KPIs, and explain how they help in evaluating the financial health of an organization.
What is a Cash Flow KPI Dashboard?
A Cash Flow KPI Dashboard is an interactive tool that tracks and displays key metrics related to a company’s cash inflows and outflows. By regularly monitoring these KPIs, businesses can make adjustments to their financial strategies to optimize cash flow and improve financial performance.
In this article, we have created a ready-to-use Cash Flow KPI Dashboard template that includes all the essential KPIs and provides clear visibility into the company’s cash flow status. This dashboard helps businesses track performance over different periods and provides an easy comparison with targets, previous years, and monthly actuals.
Key Features of the Cash Flow KPI Dashboard
Our Cash Flow KPI Dashboard includes 7 worksheets, each serving a distinct purpose:
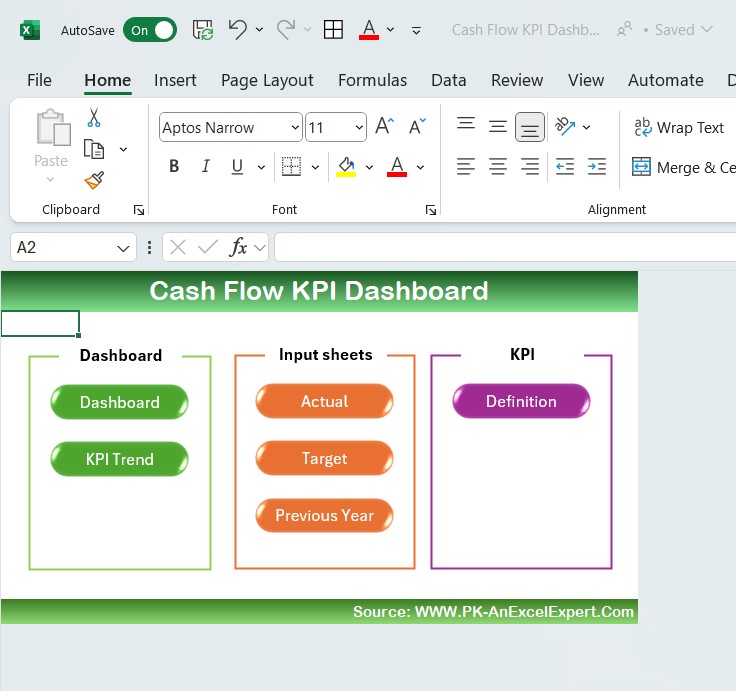
Home Sheet
This is the index sheet where you can navigate to the other worksheets using six buttons. It’s the entry point for the entire dashboard
Click to buy Cash Flow KPI Dashboard in Excel
Dashboard Sheet Tab
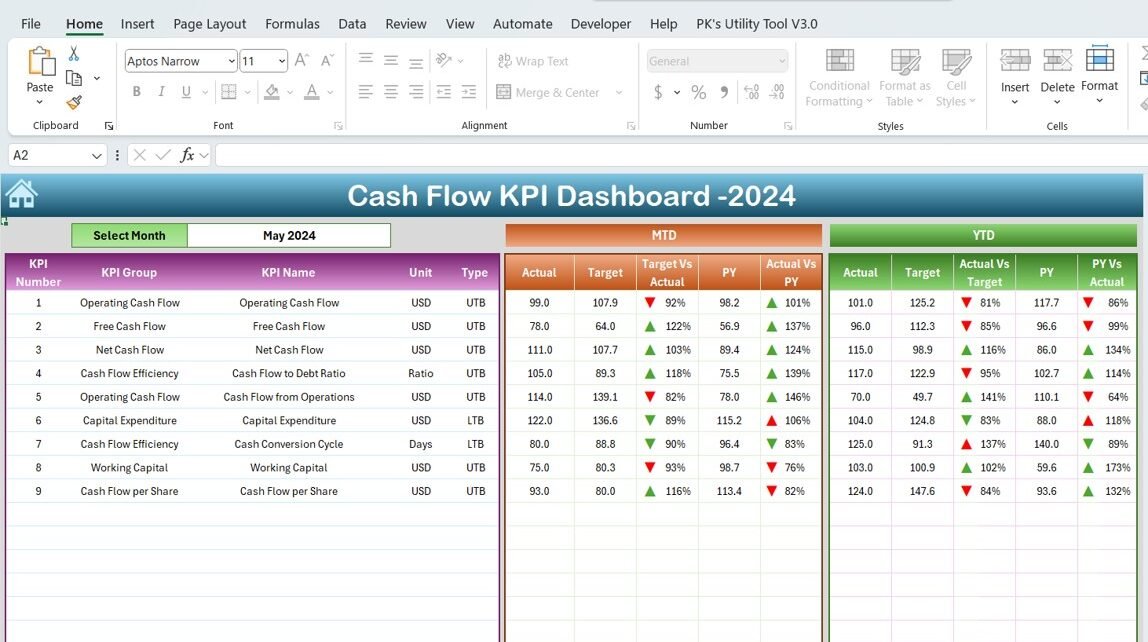
The main sheet where all the KPIs are displayed. It allows you to select the month (using the drop-down in cell D3), and the dashboard will automatically update with the relevant data for that month. Here, you’ll see both MTD Actuals, Targets, and Previous Year (PY) data. The dashboard also displays YTD (Year to Date) figures, along with conditional formatting that highlights variances with up and down arrows for visual clarity.

Click to buy Cash Flow KPI Dashboard in Excel
KPI Trend Sheet Tab
This tab allows you to select a KPI from the dropdown (cell C3). It displays the KPI group, unit of measurement, KPI type (whether “Lower the better” or “Upper the better”), and the formula used to calculate the KPI. The definition of the KPI is also provided for a deeper understanding.
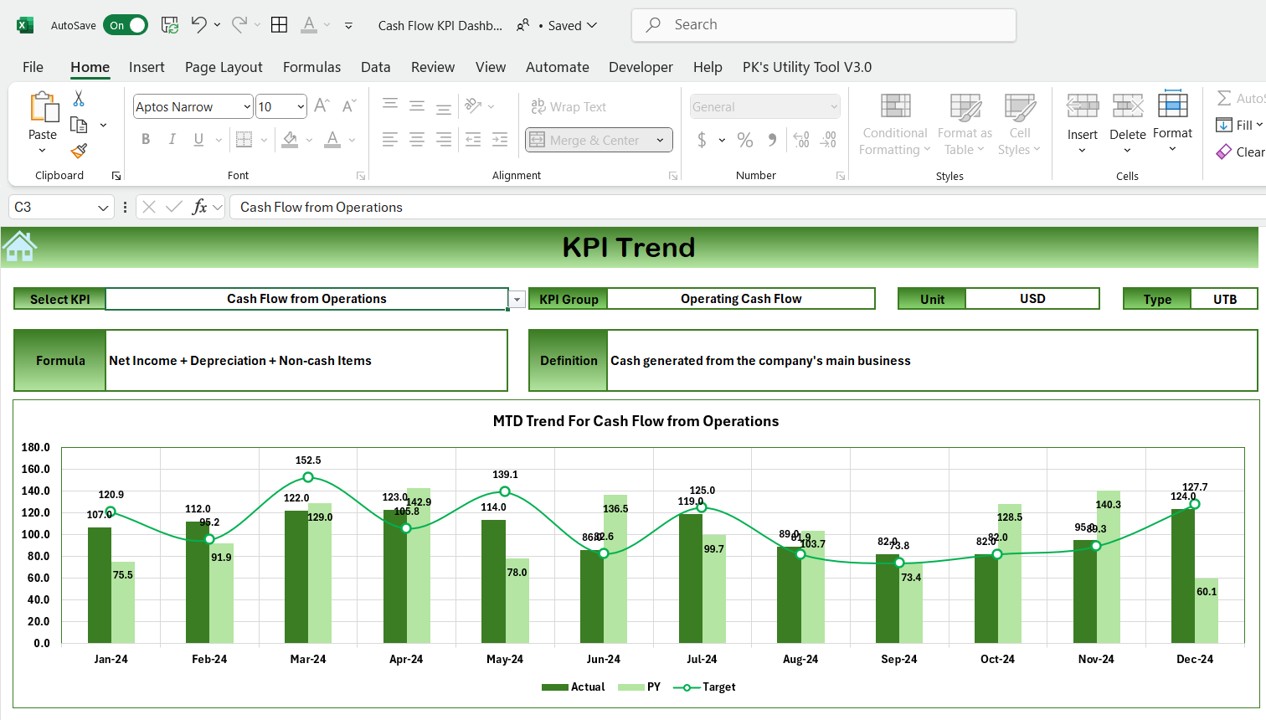
Click to buy Cash Flow KPI Dashboard in Excel
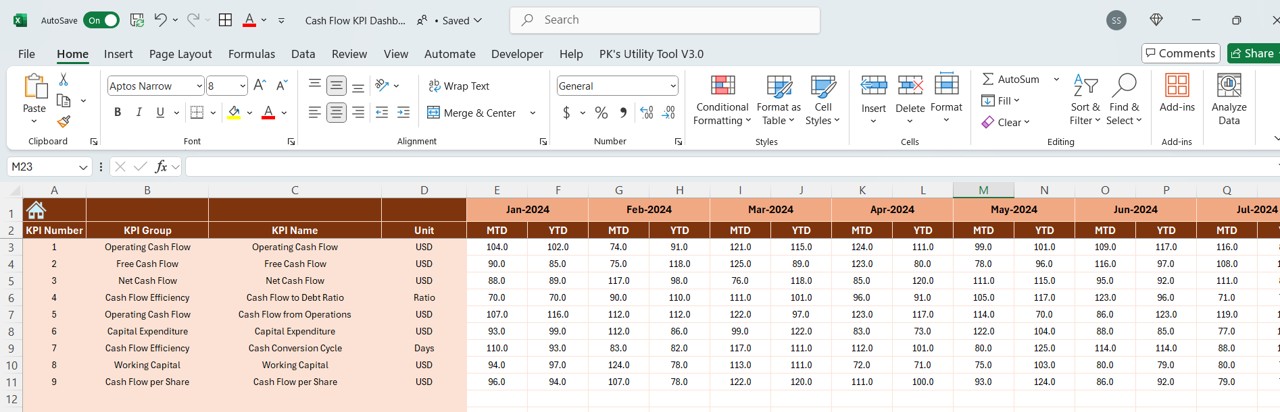
Actual Number Sheet Tab
In this sheet, you enter the actual numbers for both YTD and MTD, specifying the financial data for each month. The dashboard automatically adjusts based on the month selected in cell E1.
Click to buy Cash Flow KPI Dashboard in Excel
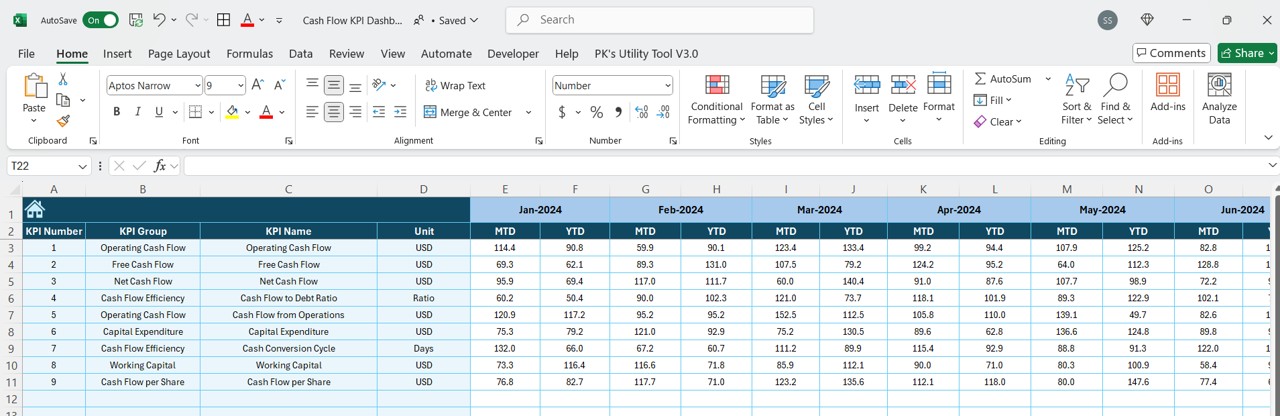
Target Sheet Tab
This sheet is for entering target numbers for each KPI, including both MTD and YTD values. You can input the target data for each month to see how it compares with actual performance.
Click to buy Cash Flow KPI Dashboard in Excel
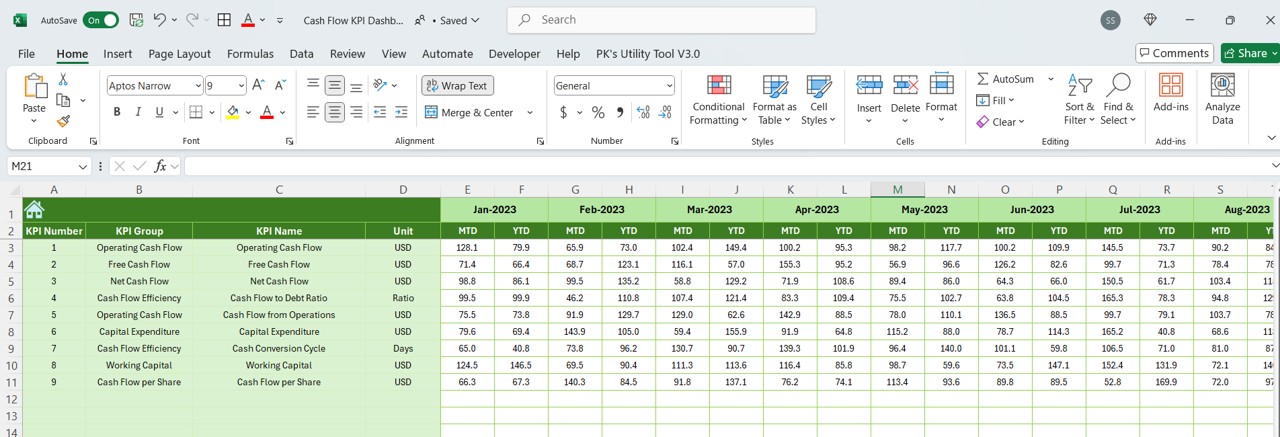
Previous Year Numbers Sheet Tab
Here, you input data from the previous year, allowing you to compare current performance against historical data.
Click to buy Cash Flow KPI Dashboard in Excel
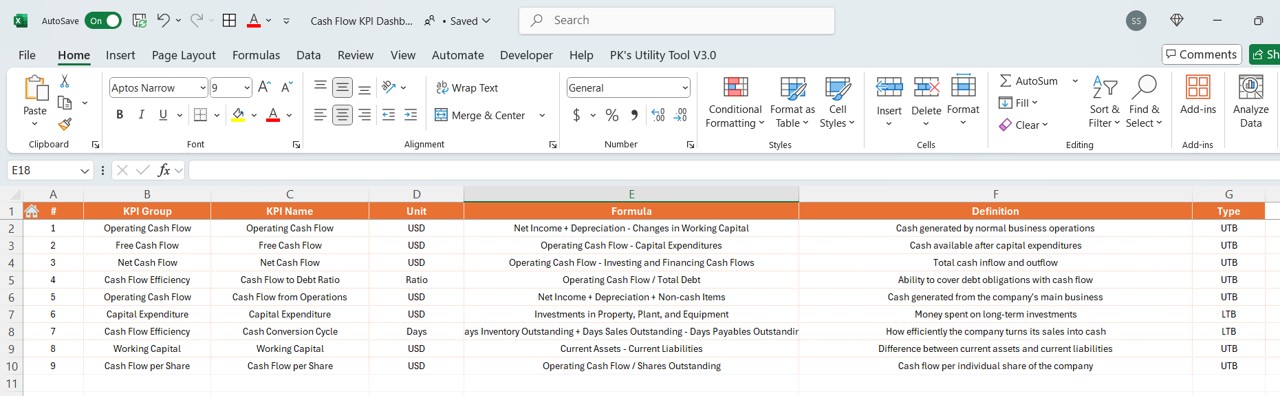
KPI Definition Sheet Tab
This sheet provides a space to enter the names, groups, units, formulas, and definitions of each KPI. It acts as a reference guide to understand each metric better.
Click to buy Cash Flow KPI Dashboard in Excel
Advantages of Using a Cash Flow KPI Dashboard
- Improved Financial Management: A Cash Flow KPI Dashboard provides real-time insights into cash flow performance, enabling businesses to proactively manage their finances. With an understanding of cash flow trends, companies can make better decisions about managing cash reserves, paying off debts, and investing in growth.
- Enhanced Decision Making: By tracking KPIs such as cash conversion cycle, working capital, and free cash flow, businesses can identify inefficiencies and take corrective actions. It allows decision-makers to adjust strategies based on current financial conditions, rather than relying on historical data alone.
- Better Forecasting: With data from the KPI dashboard, businesses can forecast future cash flows with greater accuracy. This allows for better financial planning, ensuring that businesses are prepared for fluctuations in income or expenses.
- Increased Transparency: A Cash Flow KPI Dashboard helps increase transparency within an organization. By making financial metrics accessible to key stakeholders, it encourages informed discussions about the financial health of the company.
Opportunities for Improvement in Cash Flow KPI Dashboards
- Automating Data Entry: One area for improvement is the automation of data entry. Currently, many fields require manual input, such as entering target numbers and previous year data. Implementing integration with accounting systems can help automate this process, saving time and reducing errors.
- Advanced Predictive Analytics: The dashboard could be enhanced with predictive analytics to project future cash flows more accurately. By incorporating machine learning algorithms, the dashboard could offer better insights into how cash flow will evolve based on historical data and market conditions.
- Customization for Specific Industries: Cash flow metrics vary from industry to industry. Tailoring the KPIs for specific sectors, such as manufacturing, retail, or services, could provide more relevant insights for users in different industries.
Best Practices for Cash Flow KPI Dashboards
- Regular Updates: For a Cash Flow KPI Dashboard to be effective, it’s crucial to update the data regularly. Ensuring that actual figures are entered accurately and consistently will keep the dashboard reliable and relevant.
- Ensure Data Accuracy: Accuracy in the data used for KPIs is critical. Double-check all entries, especially when comparing against targets or previous year numbers, to ensure that decisions are based on correct information.
- Focus on Key Metrics: While the dashboard may include a variety of KPIs, it’s essential to focus on the most relevant metrics for your business. Customize the dashboard to display KPIs that matter most to your financial health and growth.
- Set Realistic Targets: Setting realistic targets for each KPI will make the dashboard more effective. Targets should be based on historical performance, industry standards, and growth projections.
- Use Conditional Formatting for Quick Insights: Use conditional formatting to highlight positive and negative variances in KPIs. This provides an immediate visual cue, making it easier to understand trends and make quick decisions.
Conclusion
A Cash Flow KPI Dashboard is an essential tool for businesses to monitor their financial health, forecast cash flow, and make informed decisions. By tracking key metrics, you can ensure that your business remains financially stable and poised for growth. The ready-to-use template provided in this article simplifies the process, allowing you to track and analyze cash flow KPIs effortlessly.
With the right KPIs, practices, and insights, you can transform your approach to managing cash flow and unlock greater financial success.
Frequently Asked Questions with Answers
What is a Cash Flow KPI Dashboard?
A Cash Flow KPI Dashboard is a tool used to monitor the inflow and outflow of cash in a business. It displays key performance indicators that measure the financial health of the company.
How does the Cash Flow KPI Dashboard help businesses?
It helps businesses track cash flow in real time, identify inefficiencies, and make better financial decisions. It also provides insights into financial trends, helping companies forecast future cash flows.
What are the key KPIs in a Cash Flow KPI Dashboard?
Key KPIs include Cash Flow from Operations, Free Cash Flow, Cash Conversion Cycle, Days Sales Outstanding, and Cash Flow Margin, among others.
Is the Cash Flow KPI Dashboard customizable?
Yes, the dashboard is customizable to suit your business needs. You can adjust the KPIs, targets, and the time periods being monitored.
How often should the data in the Cash Flow KPI Dashboard be updated?
The data should be updated regularly—at least monthly or whenever there are significant changes in financial performance.
What industries benefit from using a Cash Flow KPI Dashboard?
All industries can benefit, but it’s especially useful for companies that manage large volumes of transactions, such as retail, manufacturing, and service-based industries.
Visit our YouTube channel to learn step-by-step video tutorials
View this post on Instagram
Click to buy Cash Flow KPI Dashboard in Excel