As digital marketing continues to evolve, businesses are increasingly relying on data-driven insights to optimize their online presence. One of the most essential aspects of any digital marketing strategy is Search Engine Optimization (SEO). An SEO Performance KPI Dashboard in Power BI allows you to measure and visualize SEO metrics efficiently, ensuring that you can track performance, adjust strategies, and make informed decisions to boost your online visibility.
This article will delve into the features, functionalities, and best practices of using a SEO Performance KPI Dashboard in Power BI to optimize your SEO efforts.
What is an SEO Performance KPI Dashboard in Power BI?
An SEO Performance KPI Dashboard in Power BI is a visual tool designed to monitor, analyze, and report on various SEO metrics. It enables businesses to track key performance indicators (KPIs) like website traffic, keyword rankings, and other important metrics that directly impact SEO performance.
Power BI is an advanced data visualization tool that helps transform complex data into actionable insights, and using it to track SEO performance allows for real-time monitoring and quick adjustments.
Key Features of the SEO Performance KPI Dashboard
This ready-to-use SEO Performance KPI Dashboard captures SEO data from an Excel file and visualizes it in Power BI. The dashboard is organized into three key pages, each offering specific insights into your SEO performance:
1. Summary Page
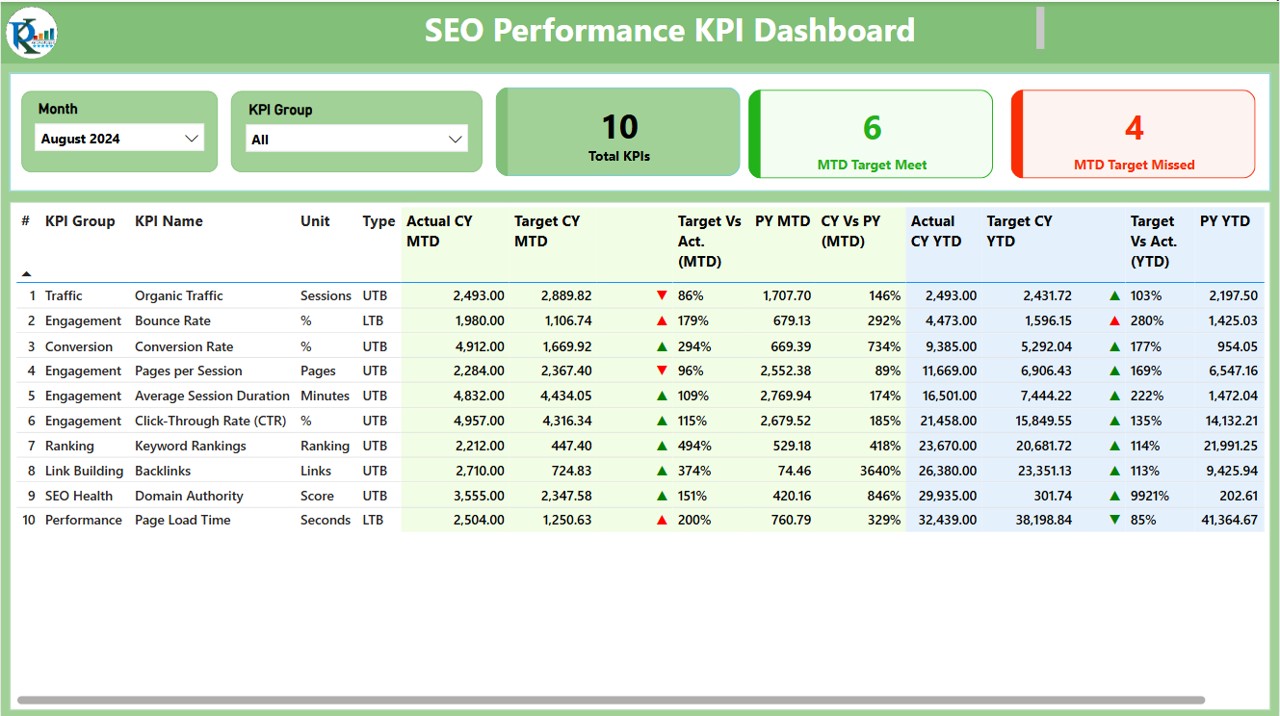
The Summary Page serves as the main page of the dashboard, providing a high-level overview of all SEO KPIs. The page is designed for quick insights into the overall performance of your SEO efforts. Key elements of the Summary Page include:
- Month and KPI Group Slicers: Allows users to filter the data by month and KPI group for detailed analysis.
- Total KPIs Count: Displays the total number of KPIs being tracked.
- MTD Target Meet Count: Shows how many KPIs have met their Month-to-Date (MTD) target.
- MTD Target Missed Count: Indicates how many KPIs have missed their MTD target.
Detailed Table Breakdown:
The detailed table on this page includes the following columns:
- KPI Number: A sequence number assigned to each KPI.
- KPI Group: The group or category to which the KPI belongs.
- KPI Name: The specific name of the KPI.
- Unit: The unit of measurement for each KPI.
- Type: Indicates whether the KPI is a “Lower the Better” (LTB) or “Upper the Better” (UTB) type.
- Actual CY MTD: The actual value of the KPI for the current year Month-to-Date (MTD).
- Target CY MTD: The target value for the KPI for the current year MTD.
- MTD Icon: An icon (▲ or ▼) indicating whether the KPI is meeting or missing the target, displayed in red or green colors.
- Target vs Actual (MTD): The percentage difference between the target and actual value for MTD (calculated as Actual MTD / Target MTD).
- PY MTD: The MTD value from the previous year for comparison.
- CY Vs PY (MTD): The percentage comparison between the current year and previous year MTD values (calculated as Current MTD / Previous MTD).
- Actual CY YTD: The actual value of the KPI for the current year Year-to-Date (YTD).
- Target CY YTD: The target value for the KPI for the current year YTD.
- YTD Icon: An icon (▲ or ▼) to indicate if the KPI is meeting or missing the YTD target.
- Target vs Actual (YTD): The percentage difference between the target and actual value for YTD (calculated as Actual YTD / Target YTD).
- PY YTD: The YTD value from the previous year for comparison.
- CY Vs PY (YTD): The percentage comparison between the current year and previous year YTD values (calculated as Current YTD / Previous YTD).
Click to buy SEO Performance KPI Dashboard in Power BI
2. KPI Trend Page
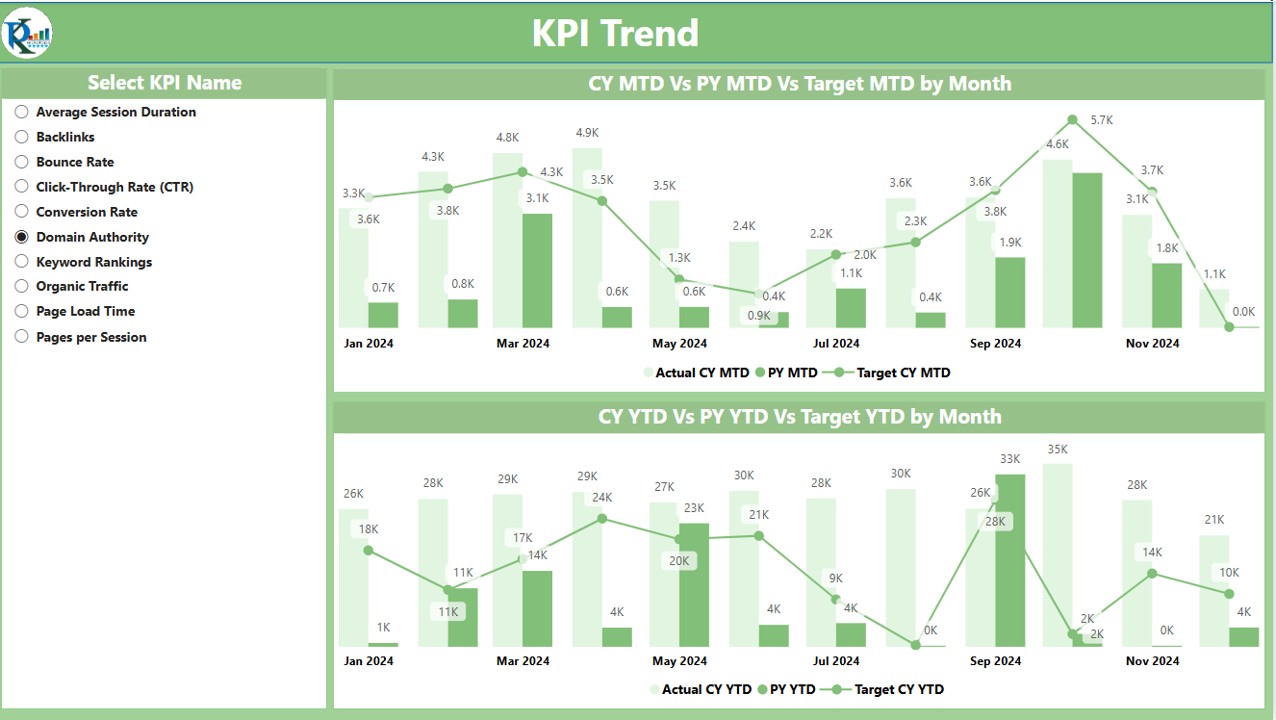
The KPI Trend Page visualizes the historical performance of KPIs, comparing the current year’s data with the previous year’s numbers. This page features:
- Combo Charts: These charts display the Actual Numbers for both the Current Year, Previous Year, and Targets for MTD and YTD.
- KPI Selector: A slicer on the left side allows users to select specific KPIs for detailed trend analysis.
This page allows users to observe the trends over time, helping identify whether your SEO efforts are improving or stagnating.
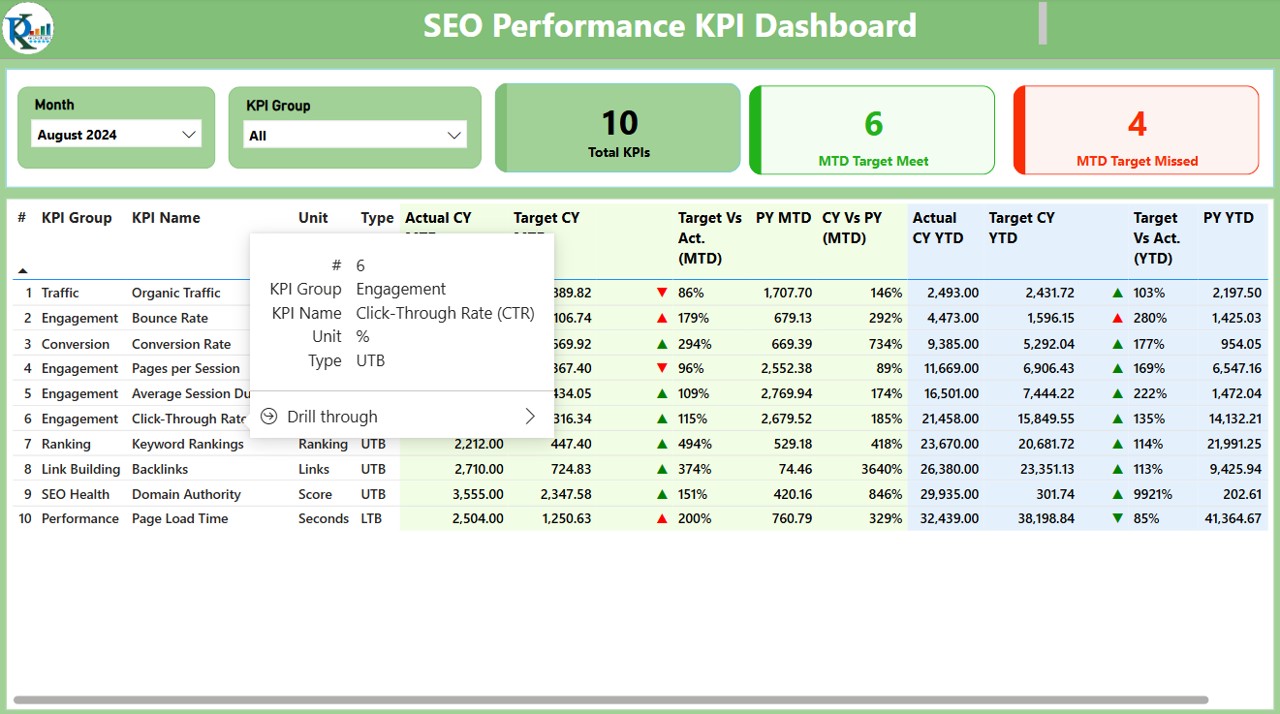
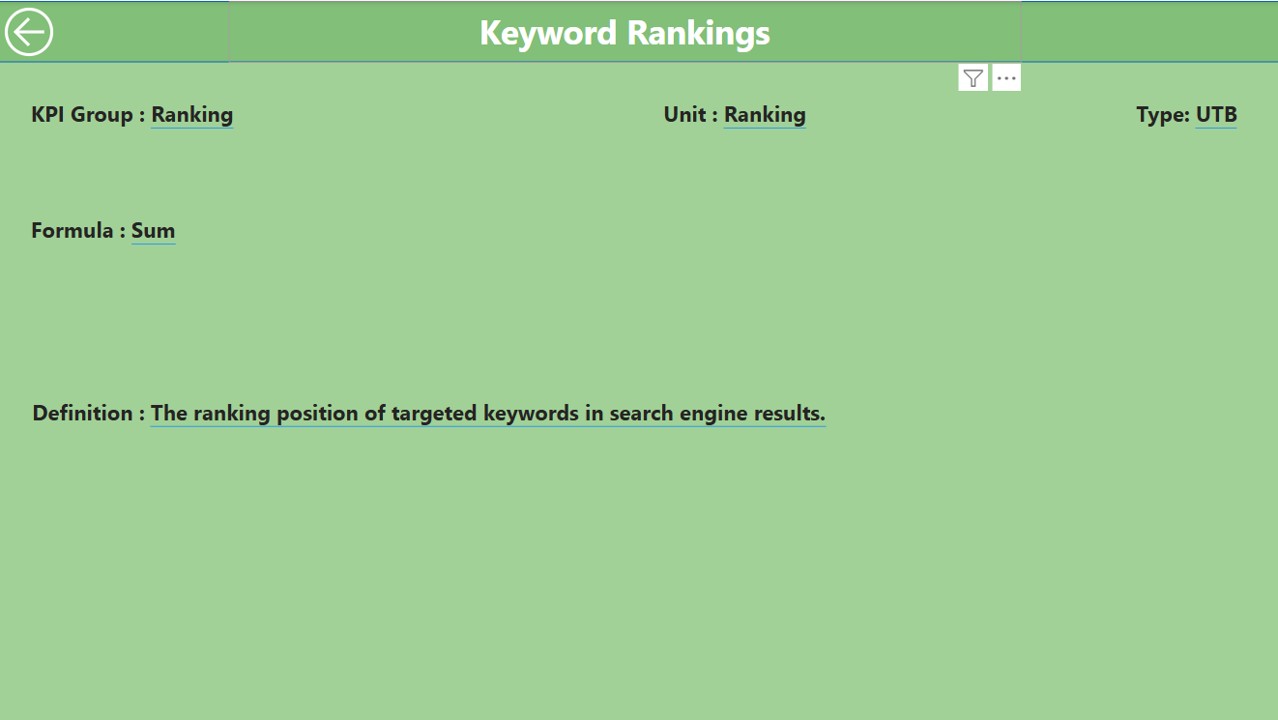
3. KPI Definition Page
The KPI Definition Page provides detailed insights into the KPIs tracked within the dashboard. Users can drill through from the Summary Page to this hidden page to see the full definition and formula for each KPI.
Click to buy SEO Performance KPI Dashboard in Power BI
Key features of the KPI Definition Page include:
- KPI Formula: A clear breakdown of how each KPI is calculated.
- KPI Definition: A detailed explanation of what each KPI measures and why it is important for SEO.
- KPI Type (LTB or UTB): Identifies whether a KPI is “Lower the Better” (e.g., Bounce Rate) or “Upper the Better” (e.g., Organic Traffic).
To return to the main page, users can simply click on the Back Button located at the top left corner.
Click to buy SEO Performance KPI Dashboard in Power BI
Data Input for the SEO Performance KPI Dashboard
The SEO Performance KPI Dashboard relies on Excel data as the input source. Here’s how you can prepare the data for each of the 3 worksheets in Excel:
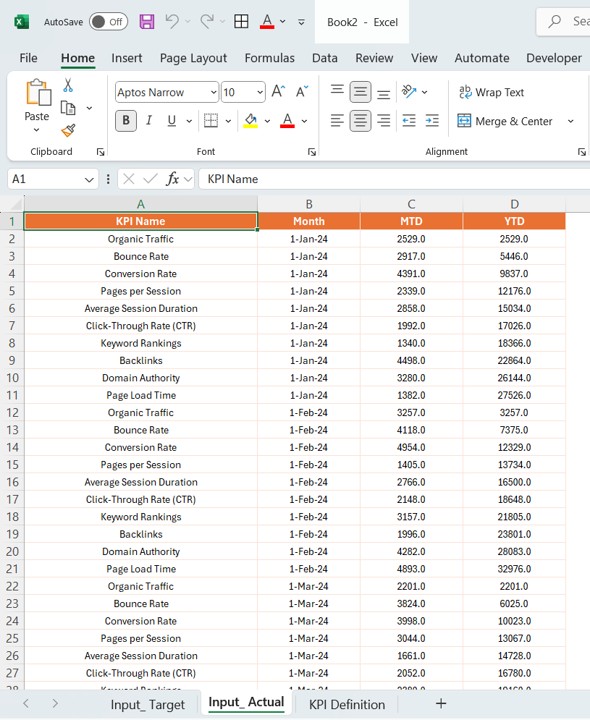
1. Input_Actual Sheet Tab
This sheet is where you input the actual values for each KPI. The columns include:
- KPI Name
- Month (use the first date of the month)
- MTD Actual Number
- YTD Actual Number
Click to buy SEO Performance KPI Dashboard in Power BI
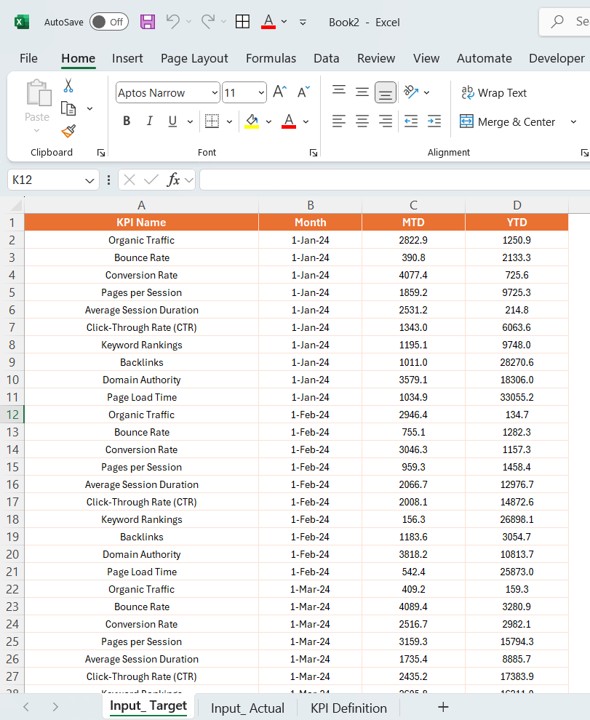
2. Input_Target Sheet Tab
Here, you input the target values for each KPI. The columns include:
- KPI Name
- Month (use the first date of the month)
- MTD Target Number
- YTD Target Number
Click to buy SEO Performance KPI Dashboard in Power BI
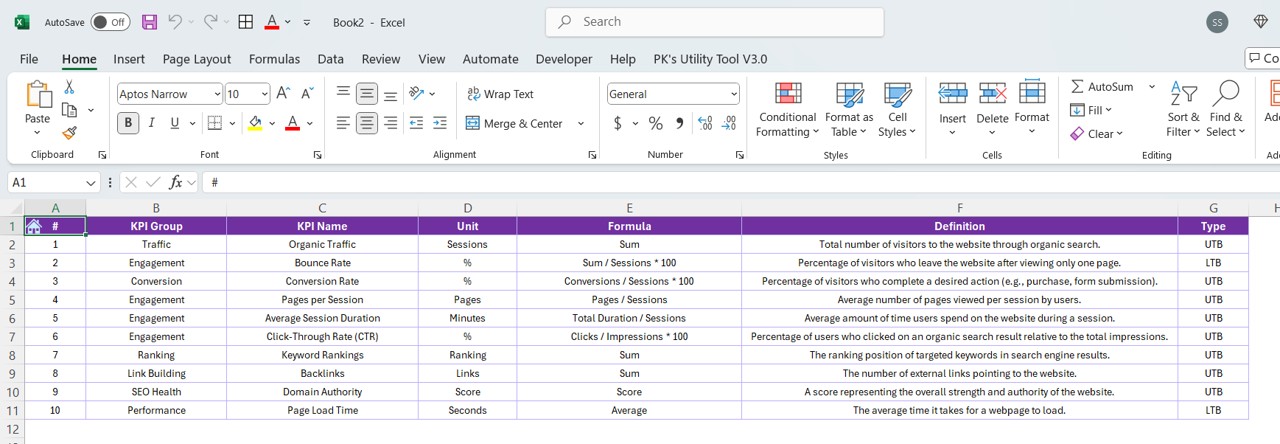
3. KPI Definition Sheet
In this sheet, you enter the definitions for each KPI. The columns include:
- KPI Number
- KPI Group
- KPI Name
- Unit
- Formula
- Definition
- Type (LTB or UTB)]
Click to buy SEO Performance KPI Dashboard in Power BI
Advantages of Using an SEO Performance KPI Dashboard in Power BI
Real-Time Data Monitoring
By using Power BI, the SEO Performance KPI Dashboard ensures that you can track SEO performance in real-time. Whether you’re analyzing daily fluctuations or monthly trends, Power BI enables you to access and review data at your fingertips.
- Centralized Data for Easy Reporting: With all SEO performance data captured in one dashboard, businesses can generate centralized reports without relying on multiple data sources or platforms. This improves efficiency and reduces errors caused by manual reporting.
- Improved Decision-Making: The KPI Trend Page helps businesses make data-driven decisions by identifying trends and patterns. By analyzing how KPIs change over time, SEO strategies can be adjusted accordingly to maximize results.
- Enhanced Data Visualization: Power BI offers powerful visualizations, making it easy to interpret complex SEO data. With features like combo charts, slicers, and drill-through capabilities, businesses can better understand their SEO performance.
- Customizable and Scalable: This dashboard can be customized to include any additional KPIs that your business may need. Power BI’s flexibility allows you to adapt the dashboard to your unique SEO reporting needs.
Opportunities for Improvement in the SEO Performance KPI Dashboard
- Incorporating More Advanced Metrics: While the dashboard covers basic SEO KPIs, there’s room for improvement by adding more advanced metrics like Click-Through Rate (CTR), Page Speed, and Backlink Growth to provide a more comprehensive view of SEO performance.
- Automation of Data Entry; Currently, data entry is manual, requiring you to update the Excel sheets regularly. Automating data collection and integration with tools like Google Analytics or SEMrush could save time and reduce the possibility of errors.
- Multi-User Access: Allowing multiple team members to access and collaborate on the dashboard simultaneously could improve teamwork and ensure everyone is on the same page regarding SEO performance.
Best Practices for Using the SEO Performance KPI Dashboard
- Regularly Update Data: To ensure the accuracy of your SEO performance data, make it a habit to update the Excel sheets with the most recent figures. Consistent updates are crucial for making timely adjustments to your SEO strategies.
- Analyze Trends Over Time: Use the KPI Trend Page to observe long-term trends in your SEO performance. Identify which KPIs are showing consistent growth and which require attention, enabling you to make informed decisions about your SEO tactics.
- Set Realistic SEO Targets: When inputting data, ensure that your targets are realistic and aligned with historical performance. Setting overly ambitious targets could skew your results and make it harder to achieve success.
- Use the Drill-Through Feature for Deeper Insights: Don’t just settle for high-level metrics—use the KPI Definition Page to drill deeper into the specifics of each KPI. Understanding the formula and purpose of each metric will help you fine-tune your SEO strategy.
- Collaborate with Your SEO Team: Share the dashboard with your SEO team and other stakeholders to ensure alignment. This collaborative approach will help keep everyone focused on the key goals and performance metrics.
Conclusion
The SEO Performance KPI Dashboard in Power BI is a powerful tool that helps businesses track and optimize their SEO efforts. By centralizing data, providing real-time insights, and offering visualizations that are easy to interpret, this dashboard enables businesses to stay on top of their SEO performance and make data-driven decisions.
Whether you are just starting with SEO or looking to fine-tune your current strategy, this dashboard provides the necessary tools to drive continuous improvement and achieve long-term success.
Frequently Asked Questions with Answers
What is an SEO Performance KPI Dashboard in Power BI?
An SEO Performance KPI Dashboard in Power BI is a tool that tracks key SEO metrics like website traffic, keyword rankings, and other important SEO KPIs, helping businesses optimize their SEO strategies.
How can I customize the SEO Performance KPI Dashboard?
You can customize the dashboard by adding new KPIs, adjusting visualizations, and modifying slicers and filters based on your specific SEO goals.
Is the dashboard data updated automatically?
Currently, the data entry is manual via Excel. However, you can automate the data import from other tools like Google Analytics for a more streamlined process.
Can multiple users access the SEO Performance KPI Dashboard?
Yes, Power BI allows for multi-user access, so you can collaborate with your team to analyze and improve SEO performance together.
What KPIs are tracked in the SEO Performance KPI Dashboard?
The dashboard tracks a variety of SEO KPIs, including Current Year MTD and YTD actuals, target comparisons, and previous year comparisons.
Visit our YouTube channel to learn step-by-step video tutorials