In the fast-paced world of video production, staying on top of your performance is essential to ensure success and meet deadlines. A Video Production KPI Dashboard in Power BI offers a visual and efficient way to track critical key performance indicators (KPIs) in real time. This tool allows you to measure, analyze, and optimize various aspects of your video production workflow, from planning to post-production.
In this article, we’ll walk you through the essential features, advantages, best practices, and opportunities for improvement of the Video Production KPI Dashboard in Power BI. Whether you’re an experienced video producer or new to the field, this guide will provide valuable insights on how to use this tool to boost your video production process.
What Is a Video Production KPI Dashboard in Power BI?
A Video Production KPI Dashboard in Power BI is a data visualization tool designed to track and analyze key performance indicators (KPIs) related to video production activities. Using Power BI, this dashboard helps you stay organized, monitor the success of your video production process, and make data-driven decisions.
The dashboard tracks important KPIs like:
- Total KPIs count.
- MTD (Month-to-Date) Target Meet/Miss count.
- YTD (Year-to-Date) progress for each video production task.
- Comparison between current and previous year data.
- Target vs Actual performance for both MTD and YTD.
This dashboard enables video production teams to visualize performance metrics at a glance, streamlining the process of tracking progress, identifying bottlenecks, and improving overall performance.
Key Features of the Video Production KPI Dashboard in Power BI
The Video Production KPI Dashboard in Power BI comes with several powerful features to help you track video production KPIs efficiently. Here are the key components of the dashboard:
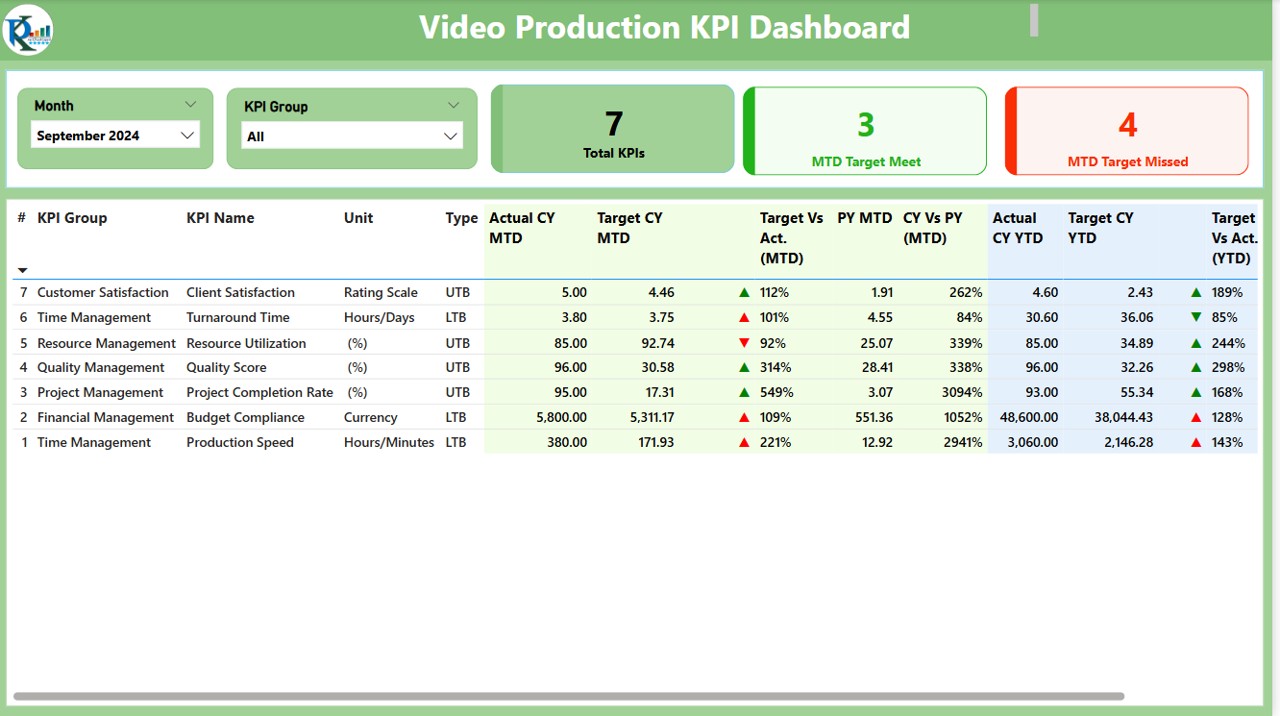
1. Summary Page
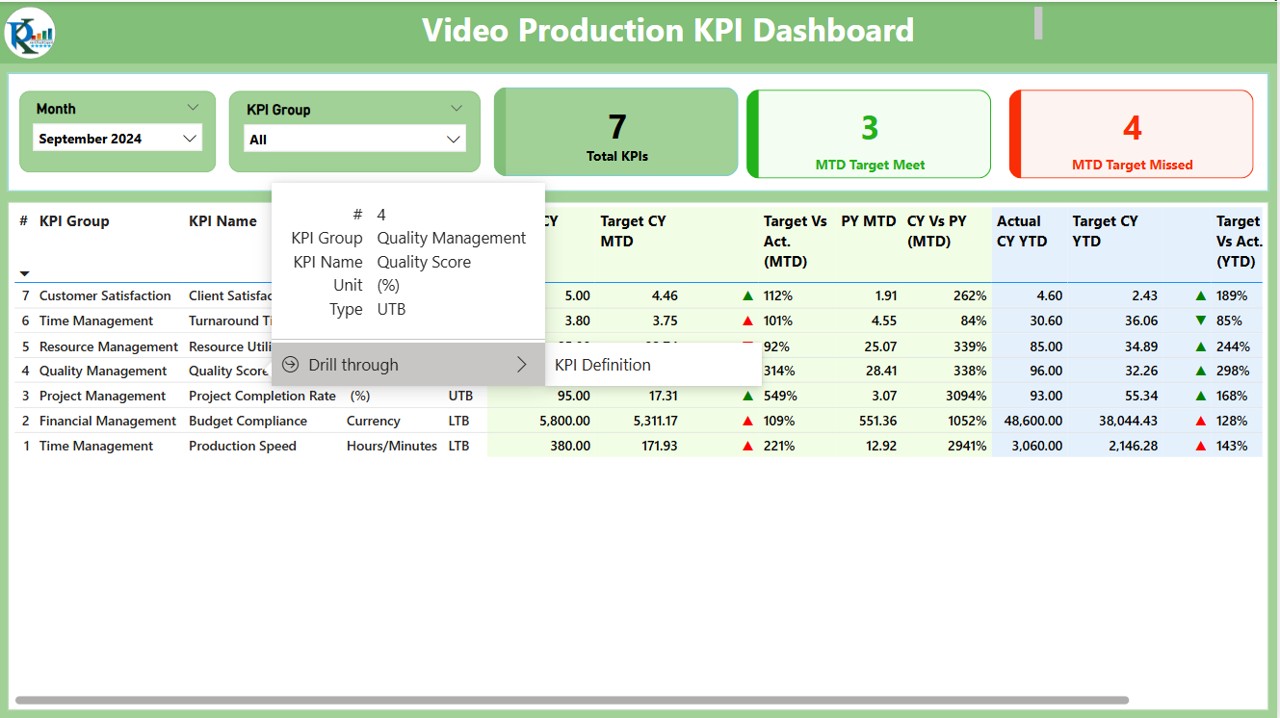
The Summary Page serves as the main overview page, providing an at-a-glance summary of the video production KPIs. Key elements of this page include:
Month and KPI Group Slicer: These slicers allow you to filter the dashboard by month and KPI group, helping you focus on specific areas.
Total KPIs Count: A card that displays the total number of KPIs in the dashboard.
MTD Target Meet and Miss Count: These cards show how many KPIs met or missed their targets in the current month.
Detailed Table: Below the cards, you will find a table that includes the following details:
- KPI Number: The unique number assigned to each KPI.
- KPI Group: The category to which each KPI belongs (e.g., Planning, Editing, Quality Assurance).
- KPI Name: The name of the KPI.
- Unit: The measurement unit used for the KPI (e.g., hours, percentage).
- Type: Whether the KPI is “Lower the Better” (LTB) or “Upper the Better” (UTB).
- Actual CY MTD: The actual value for the current year’s month-to-date performance.
- Target CY MTD: The target value for the current month.
- MTD Icon: Conditional icons (▼ and ▲) show whether the KPI is meeting or missing its target.
- Target Vs Actual (MTD): The percentage difference between the target and actual MTD values.
- PY MTD: The previous year’s month-to-date value for the same KPI.
- CY Vs PY (MTD): The percentage difference between the current year and previous year’s MTD data.
- Actual CY YTD: The actual year-to-date value for the KPI.
- Target CY YTD: The year-to-date target value.
- YTD Icon: Conditional icons (▼ and ▲) show whether the KPI is meeting or missing its YTD target.
- Target Vs Actual (YTD): The percentage difference between the target and actual YTD values.
- PY YTD: The previous year’s year-to-date value.
- CY Vs PY (YTD): The percentage difference between the current year and previous year’s YTD data.
Click to buy Video Production KPI Dashboard in Power BI
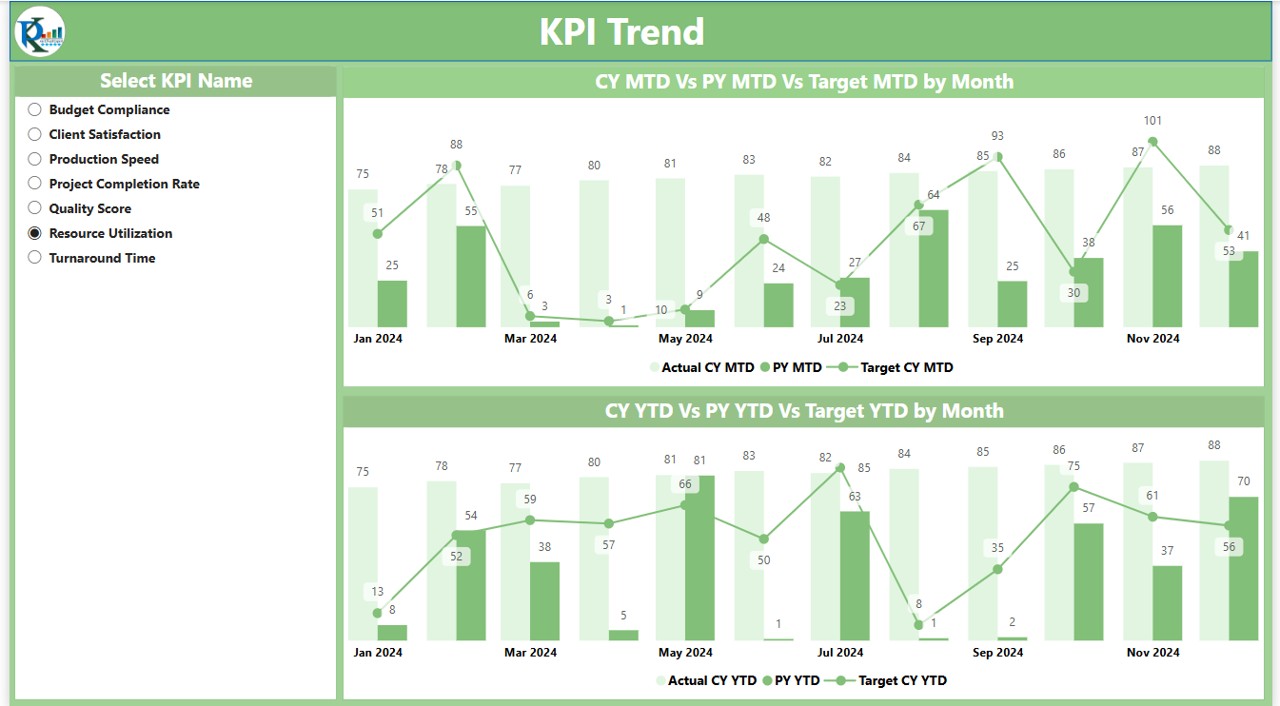
2. KPI Trend Page
The KPI Trend Page provides visualizations of the performance trends for different KPIs:
- Combo Charts: The page displays combo charts for both MTD and YTD, showing actual numbers for the current year, previous year, and targets.
- KPI Selection Slicer: A slicer is provided on the left to select different KPIs for detailed analysis.
Click to buy Video Production KPI Dashboard in Power BI
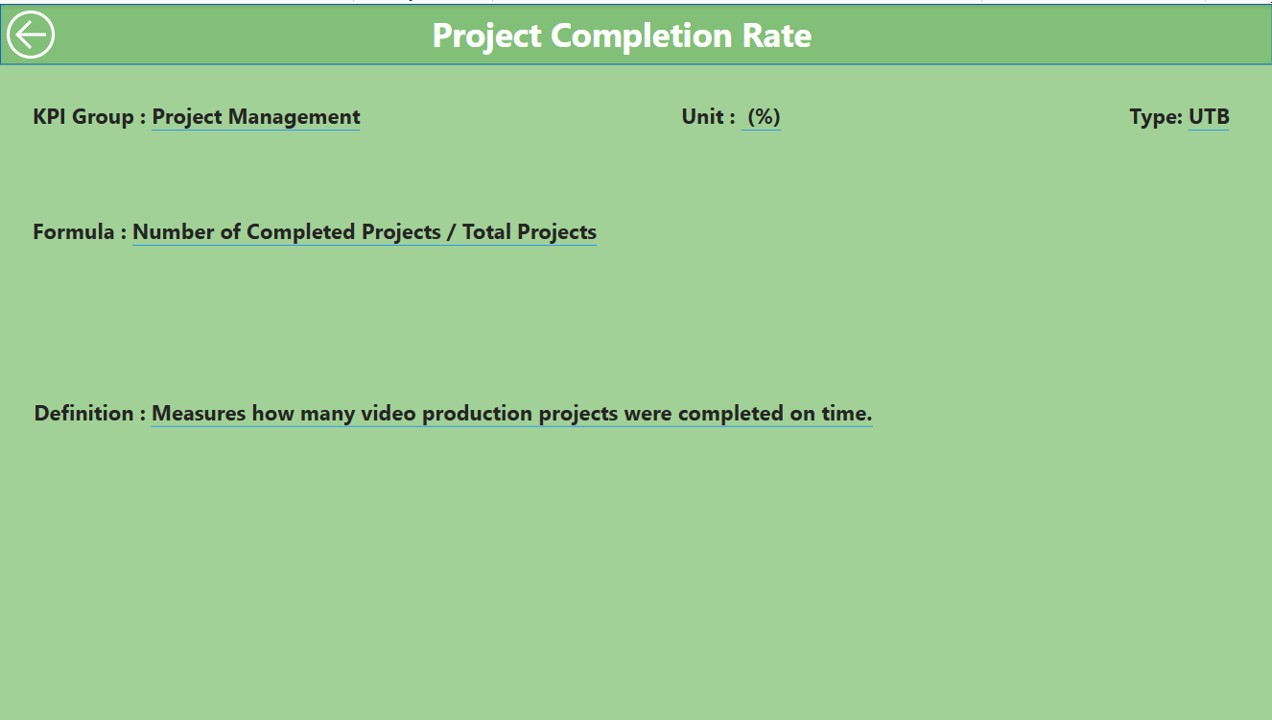
3. KPI Definition Page
The KPI Definition Page provides detailed information about each KPI:
Click to buy Video Production KPI Dashboard in Power BI
- Drill-Through Functionality: You can drill down to see detailed KPI information, including the formula, definition, and type.
- Back Button: A back button allows you to return to the main summary page for quick navigation.
Click to buy Video Production KPI Dashboard in Power BI
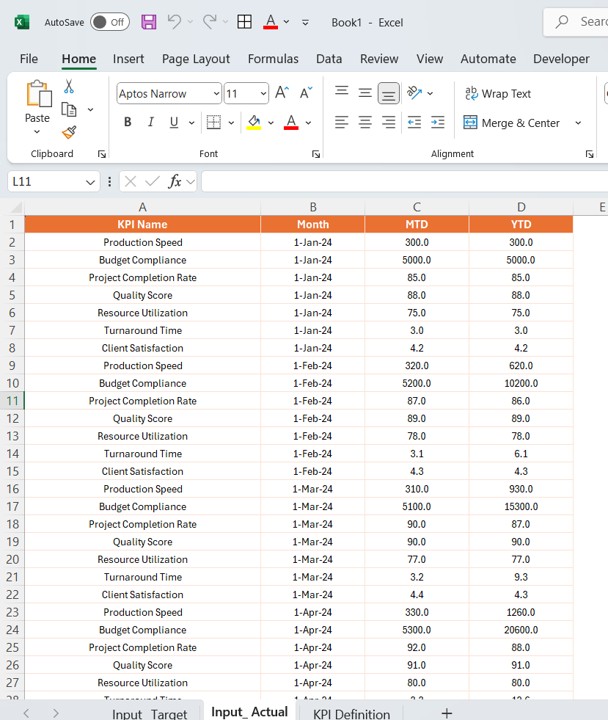
4. Excel Data Source
The data source for this Power BI dashboard is an Excel file, which includes the following sheets:
- Input_Actual Sheet: You enter the actual numbers for each KPI, including the month (take the first date of the month), MTD numbers, and YTD numbers.
Click to buy Video Production KPI Dashboard in Power BI
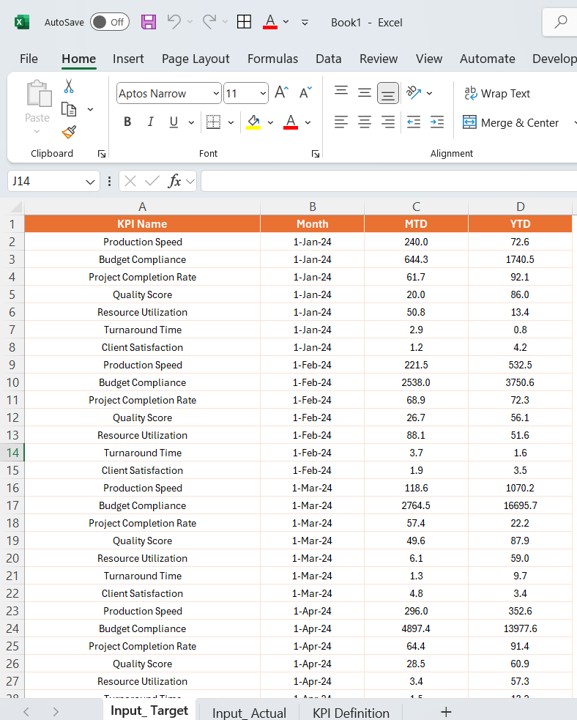
- Input_Target Sheet: You enter the target numbers for each KPI for the month and year.
Click to buy Video Production KPI Dashboard in Power BI
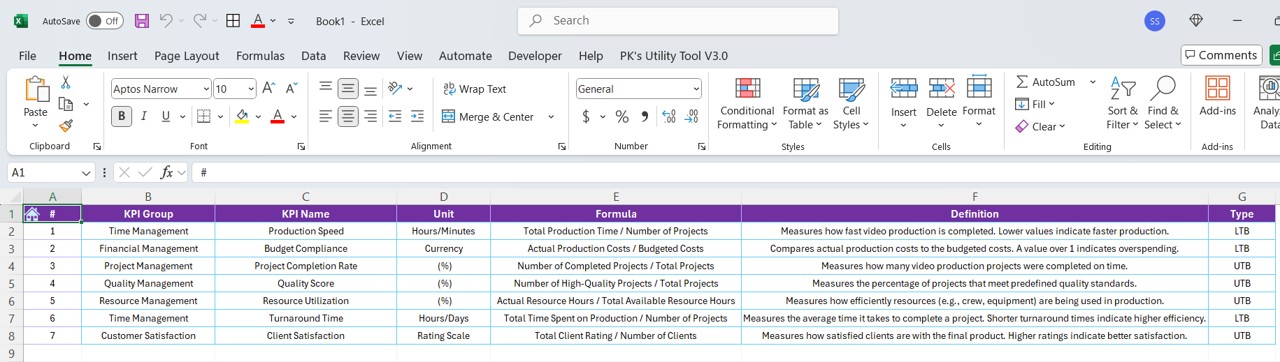
- KPI Definition Sheet: This sheet contains the KPI number, KPI group, KPI name, unit of measurement, formula, definition, and type.
Click to buy Video Production KPI Dashboard in Power BI
Advantages of the Video Production KPI Dashboard in Power BI
A Video Production KPI Dashboard in Power BI offers many advantages, especially for teams looking to optimize their video production process. Below are the key benefits:
- Real-Time Performance Tracking: The dashboard allows for real-time tracking of KPIs, making it easier to monitor the performance of various video production tasks. By tracking both MTD and YTD data, you can quickly identify which KPIs are on target and which ones need attention.
- Visual Data Representation: Using Power BI’s advanced data visualization tools, the dashboard presents data in a visually appealing and easy-to-understand way. You can use combo charts, slicers, and icons to quickly analyze trends and spot issues.
- Detailed Insights: By drilling down into each KPI, you can get detailed insights into performance, formulas, and definitions. This helps you understand the underlying factors contributing to the success or failure of a KPI.
- Efficient Performance Management: With access to all KPIs in one place, video production teams can manage performance more efficiently. You can focus on areas that are underperforming and implement corrective measures quickly.
- Easy Comparison with Previous Year”: The dashboard allows you to compare current performance against the previous year, providing valuable insights into year-over-year progress. This helps you assess improvements and identify trends.
Opportunities for Improvement in the Video Production KPI Dashboard
While the Video Production KPI Dashboard in Power BI is an incredibly powerful tool, there are several opportunities for improvement:
- Integration with Other Systems: Integrating the dashboard with other video production tools, project management software, or content management systems could help automate data entry and improve accuracy.
- Customization of KPIs: While the dashboard provides several predefined KPIs, the ability to customize KPIs according to specific production needs could make it more adaptable to different production environments.
- Advanced Analytics: Incorporating predictive analytics could help forecast future performance based on historical data. This could provide early warnings for potential issues, enabling proactive intervention.
- Enhanced Mobile Compatibility: Creating a mobile version of the dashboard would allow video production teams to monitor performance on-the-go, ensuring that everyone stays updated, no matter where they are.
Best Practices for Using the Video Production KPI Dashboard
To make the most of the Video Production KPI Dashboard in Power BI, here are some best practices:
- Regularly Update Data: Ensure that the data is updated regularly to reflect the most current performance. Inputting data frequently helps keep the dashboard relevant and accurate.
- Focus on Key KPIs: While the dashboard tracks a variety of KPIs, focus on the ones that directly impact the efficiency and quality of your video production. Identify the KPIs that matter the most for your team.
- Set Clear Targets: Define clear, achievable targets for each KPI. This helps create a sense of direction and ensures that everyone is working towards the same goals.
- Use Data for Continuous Improvement: Regularly analyze the data and use it to identify areas for improvement. This will help you refine your video production process and eliminate bottlenecks.
- Share Insights with the Team: Share the dashboard insights with the team regularly. Use the data to engage in productive discussions about performance, challenges, and solutions.
Frequently Asked Questions (FAQ)
Q1: How do I update the data in the Video Production KPI Dashboard?
You can update the data by entering the actual numbers, target numbers, and previous year data in the respective sheets in the Excel file.
Q2: Can I customize the KPIs in the dashboard?
Yes, the dashboard allows you to add or modify KPIs based on your specific video production needs. You can adjust the KPIs in the Excel data sheets.
Q3: How can I compare performance with the previous year?
The dashboard compares the current MTD and YTD numbers with the same period in the previous year. The comparison percentage is displayed for easy reference.
Q4: Can I access the dashboard on my mobile?
While the current version is designed for desktop use, you can explore Power BI’s mobile app to access the dashboard on your mobile device.
Q5: How do I interpret the icons in the dashboard?
The red ▼ icon indicates that the KPI is underperforming, while the green ▲ icon indicates that the KPI is performing well and meeting or exceeding the target.
Conclusion
The Video Production KPI Dashboard in Power BI is an invaluable tool for any video production team. It allows you to track key performance indicators in real time, providing insights that help optimize production workflows, meet deadlines, and improve efficiency. By following best practices, regularly updating data, and leveraging the dashboard’s powerful features, you can ensure that your video production process stays on track and continues to improve year over year.
View this post on Instagram
Visit our YouTube channel to learn step-by-step video tutorials
Click to buy Video Production KPI Dashboard in Power BI