In today’s data-driven business landscape, monitoring and analyzing sales performance is crucial. A Sales Funnel KPI Dashboard in Excel is an essential tool for tracking key sales metrics, evaluating progress, and making data-driven decisions.
This article will provide a detailed breakdown of the Sales Funnel KPI Dashboard in Excel, explaining its structure, key features, benefits, and best practices. By the end of this guide, you will have a clear understanding of how to use this dashboard effectively for your sales strategy.
Click to Sales Funnel KPI
What is a Sales Funnel KPI Dashboard?
A Sales Funnel KPI Dashboard is a visual representation of key performance indicators (KPIs) related to the sales funnel. It allows businesses to:
- Track leads and conversions
- Compare actual performance vs. targets
- Identify bottlenecks in the sales process
- Optimize marketing and sales strategies
- Enhance forecasting and decision-making
Using Excel, you can create a highly functional and interactive dashboard that simplifies KPI tracking for your team.
Key Features of the Sales Funnel KPI Dashboard in Excel
This ready-to-use Sales Funnel KPI Dashboard consists of seven worksheets, each serving a unique purpose:
Home Sheet
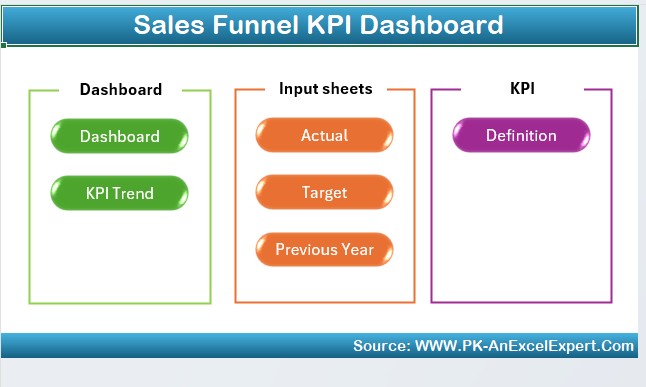
- Acts as the index sheet.
- Contains six navigation buttons to jump to respective sheets.
- Provides an organized view for easy access.
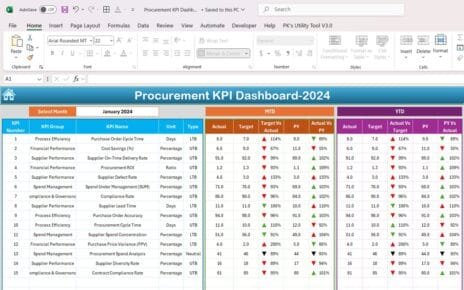
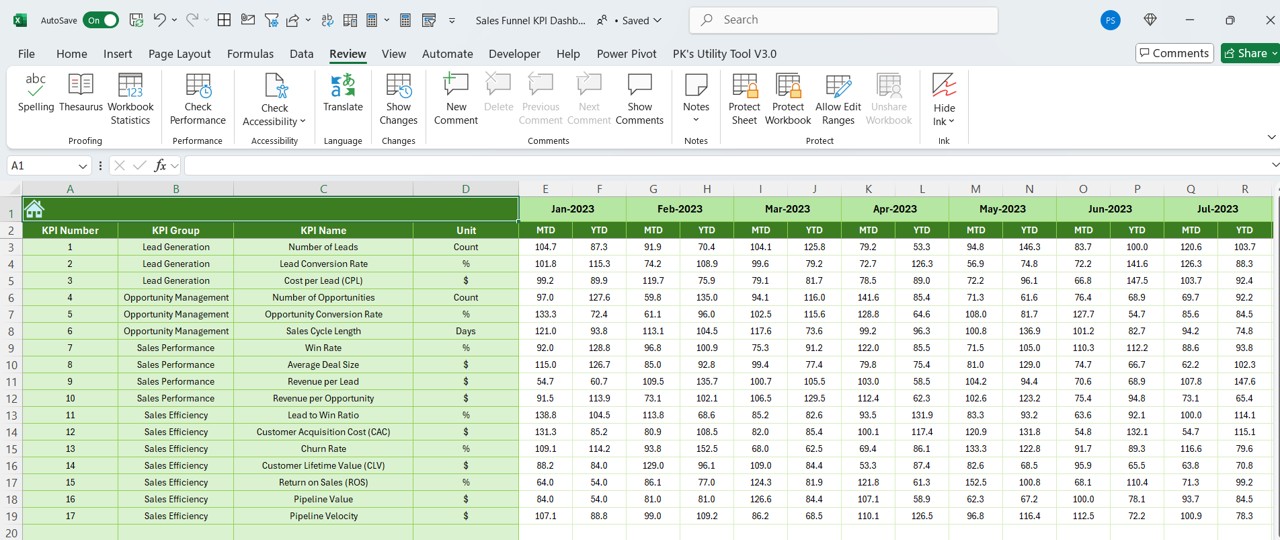
Dashboard Sheet Tab
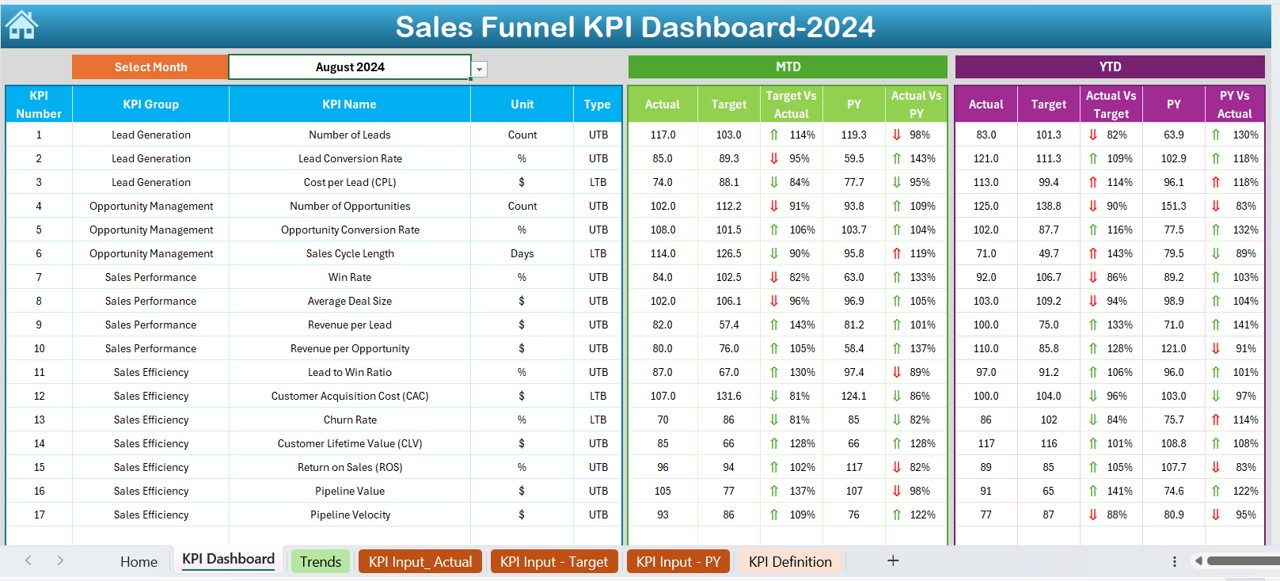
- The main dashboard displaying all KPIs.
- Users can select the Month (D3) from a drop-down menu.
Displays:
- MTD (Month-to-Date) and YTD (Year-to-Date) Actual vs. Target vs. Previous Year Data.
- Conditional formatting with up/down arrows to show performance trends.
Click to Sales Funnel KPI
KPI Trend Sheet Tab
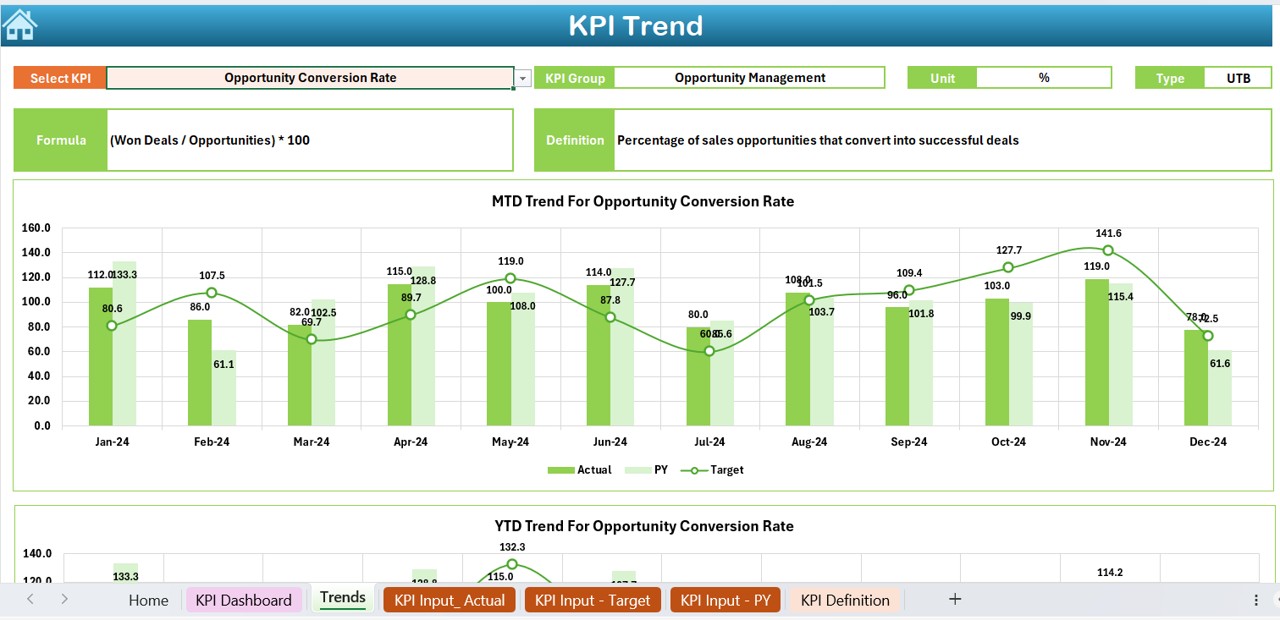
- Users can select a specific KPI (C3 drop-down).
Displays:
- KPI Group, Unit, Type (Lower/Upper is better), Formula, and Definition.
- MTD and YTD trend charts for Actual, Target, and Previous Year Data.
Actual Numbers Input Sheet
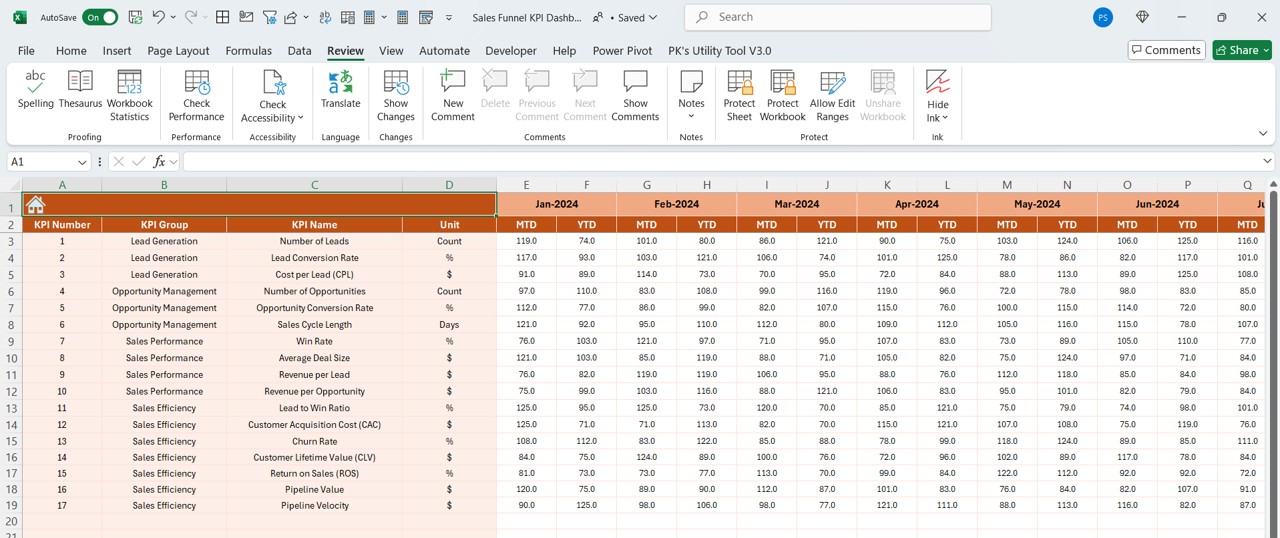
- Allows users to enter actual MTD and YTD data.
- Change months easily via cell E1 (input first month of the year).
Target Sheet Tab
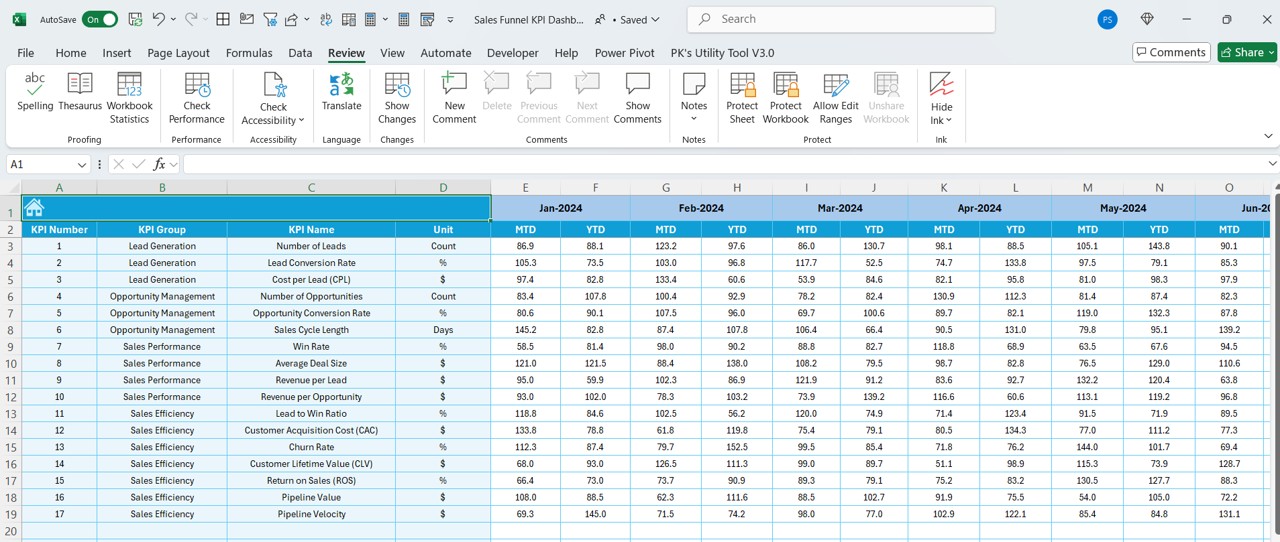
- Users enter MTD and YTD target values for each KPI.
- Ensures alignment with business objectives.
Previous Year Number Sheet Tab
- Stores last year’s data, structured identically to the current year.
- Helps in trend analysis and performance comparison.
Click to Sales Funnel KPI
KPI Definition Sheet Tab
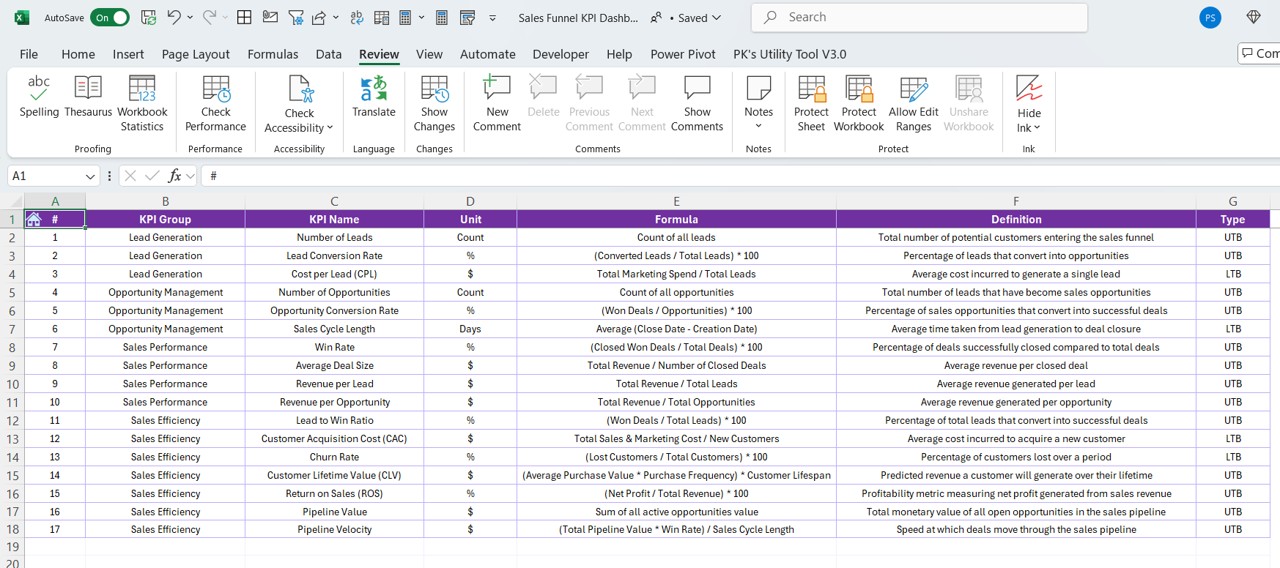
- Maintains a database of KPIs, including:
- KPI Name, Group, Unit, Formula, and Definition.
- Ensures consistency and clarity for all stakeholders.
Advantages of Using a Sales Funnel KPI Dashboard in Excel
- Improved Sales Visibility: A well-structured dashboard consolidates all sales data into one place, offering a clear view of sales trends and performance.
- Easy Performance Tracking: With MTD and YTD analysis, teams can track how close they are to achieving targets and adjust strategies accordingly.
- Data-Driven Decision Making: Analyzing past and present data helps businesses predict future trends and make strategic sales decisions.
- Identifies Weaknesses in the Sales Funnel: By pinpointing where conversions drop, businesses can optimize strategies to improve lead nurturing and closing rates.
- Customizable and Scalable: Excel dashboards are highly customizable, making them suitable for small businesses to large enterprises.
Best Practices for Using the Sales Funnel KPI Dashboard
- Keep Data Updated: Regularly update actual, target, and previous year’s data to ensure accurate reporting.
- Define KPIs Clearly: Make sure all KPIs are well-defined in the KPI Definition Sheet to avoid misinterpretations.
- Use Conditional Formatting Effectively: Leverage color-coded indicators to quickly assess performance gaps.
- Monitor Trends Over Time: Compare current performance vs. historical trends to identify growth patterns or concerns.
- Optimize for Presentation and Usability: Ensure a clean layout, easy navigation, and interactive elements to enhance usability.
Conclusion
The Sales Funnel KPI Dashboard in Excel is an indispensable tool for tracking sales performance and optimizing the sales funnel. By using this dashboard, businesses can gain valuable insights, streamline reporting, and improve decision-making.
Frequently Asked Questions (FAQs)
What is a Sales Funnel KPI Dashboard?
A Sales Funnel KPI Dashboard is a visual tool that tracks sales funnel metrics like leads, conversions, targets, and actual performance to help businesses monitor sales progress.
How do I customize the Sales Funnel KPI Dashboard?
You can customize the dashboard by modifying the KPI definitions, adjusting data input sheets, and updating trend charts according to your business needs.
What are the most important KPIs to track in a sales funnel?
- Some essential KPIs include:
- Lead Conversion Rate
- Customer Acquisition Cost
- Sales Growth Rate
- Average Deal Size
- Sales Target vs. Actual Performance
Why should I use Excel instead of a dedicated CRM?
Excel provides a cost-effective, customizable, and flexible solution for businesses that want to track sales performance without investing in expensive software.
Can I integrate this dashboard with other tools?
Yes! You can export Excel data to Power BI, Google Sheets, or CRM software for more advanced reporting and automation.
Click to Sales Funnel KPI
Visit our YouTube channel to learn step-by-step video tutorials
View this post on Instagram