Managing accounts receivable (AR) effectively is crucial for maintaining a healthy cash flow and ensuring that a business has enough liquidity to operate smoothly. An Accounts Receivable KPI Dashboard serves as a valuable tool for businesses to monitor and analyze key performance indicators (KPIs) related to accounts receivable. By using a dashboard, businesses can gain real-time insights into their AR process, track performance against targets, and make data-driven decisions.
In this article, we will explore the Accounts Receivable KPI Dashboard, its key features, the KPIs it tracks, and best practices for using it effectively. We will also delve into opportunities for improvement and how this tool can enhance your overall financial management strategy.
What is an Accounts Receivable KPI Dashboard?
An Accounts Receivable KPI Dashboard is a visual tool that consolidates all the key data points about a company’s accounts receivable performance. This dashboard provides businesses with easy-to-understand visualizations of key metrics such as days sales outstanding (DSO), the collection efficiency ratio, overdue invoices, and more. By tracking these KPIs, businesses can evaluate how efficiently they are managing their receivables and identify areas that need attention.
Using a dashboard for this purpose makes it easier to monitor accounts receivable metrics, as it brings all the data into one place, updating it in real-time. The Accounts Receivable KPI Dashboard helps finance teams spot trends, monitor targets, and make informed decisions to optimize cash flow.
Key Features of the Accounts Receivable KPI Dashboard
The Accounts Receivable KPI Dashboard is a ready-to-use template that comes with various features to facilitate effective tracking and management. Below are the key features of this template:
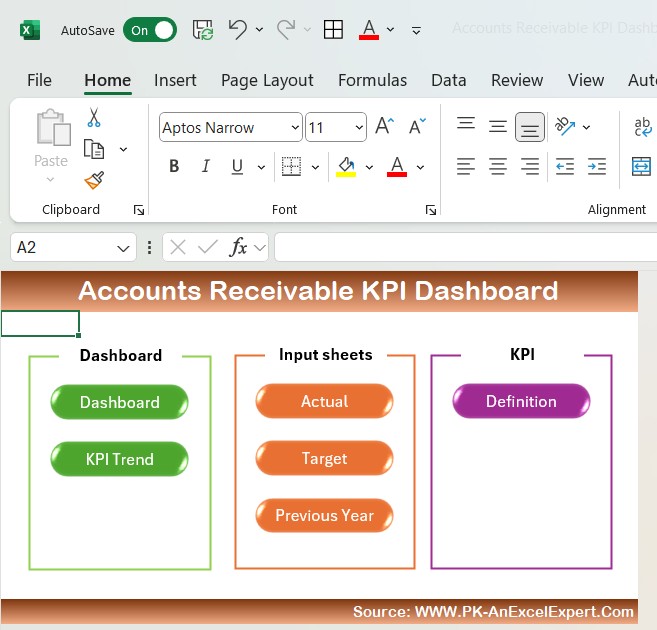
1. Home Sheet
The Home Sheet is the index page of the dashboard. It includes six buttons that provide easy navigation to the respective sheets. This sheet serves as the control center for your dashboard, making it user-friendly and efficient.
Click to buy Accounts Receivable KPI Dashboard in Excel
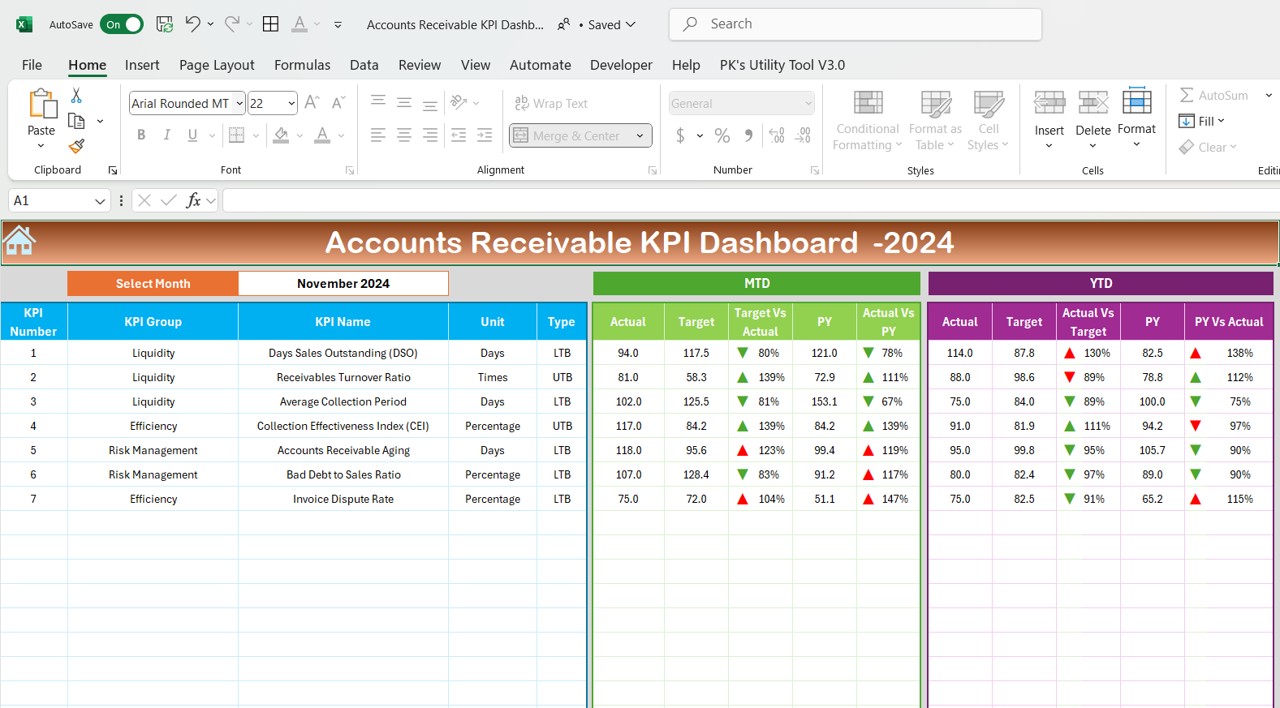
2. Dashboard Sheet Tab
The Dashboard Sheet Tab is the main page of the Accounts Receivable KPI Dashboard. Here, users can:
- Select the Month: A dropdown menu allows users to select a specific month, and the entire dashboard updates with the data for that month.
- MTD and YTD Performance: The dashboard shows both Month-to-Date (MTD) and Year-to-Date (YTD) actual data, targets, and previous year’s data.
- Conditional Formatting: Up and down arrows (conditional formatting) are used to indicate whether the current performance is above or below the target.
Click to buy Accounts Receivable KPI Dashboard in Excel
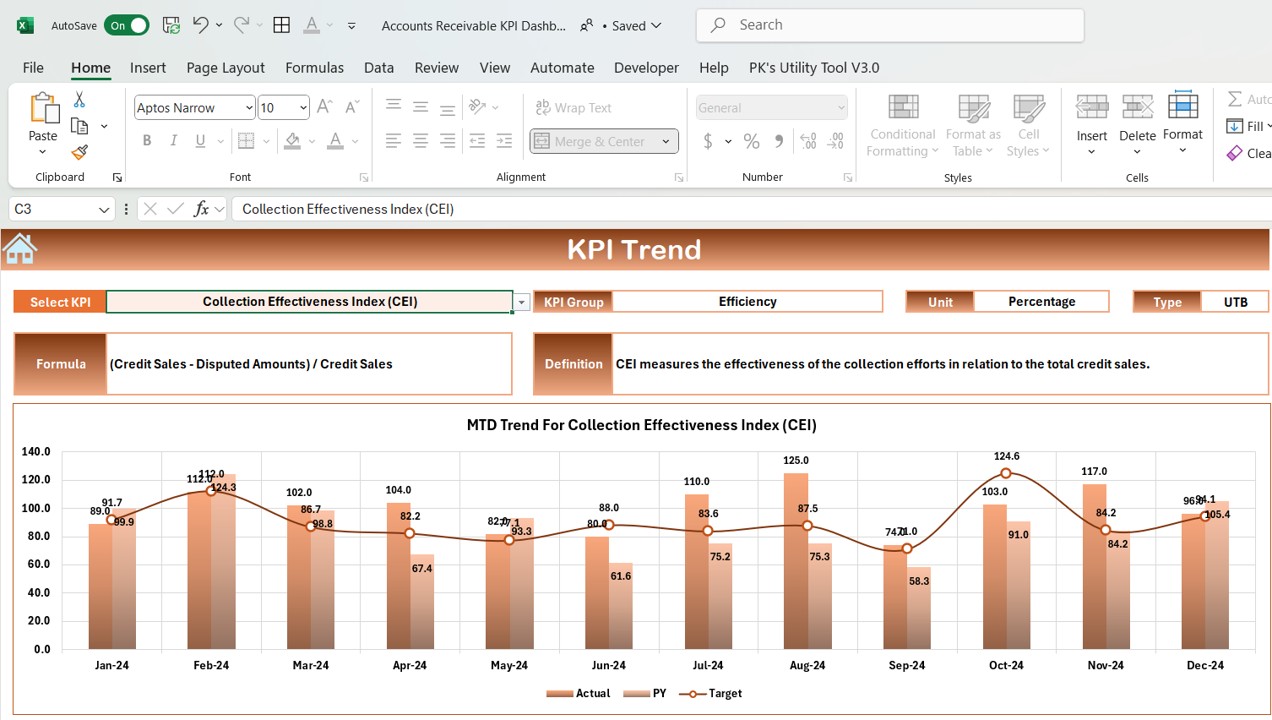
3. KPI Trend Sheet Tab
In the KPI Trend Sheet Tab, users can track the performance of a selected KPI. The features include:
- KPI Selection: Users can choose the specific KPI from a dropdown list (located in range C3).
- KPI Group and Unit: Displays the group and unit of the selected KPI.
- KPI Type (LTB/UTB): Indicates whether the KPI is “Lower the Better” (LTB) or “Upper the Better” (UTB).
- KPI Formula and Definition: Shows the formula used to calculate the KPI and its definition for better understanding.
Click to buy Accounts Receivable KPI Dashboard in Excel
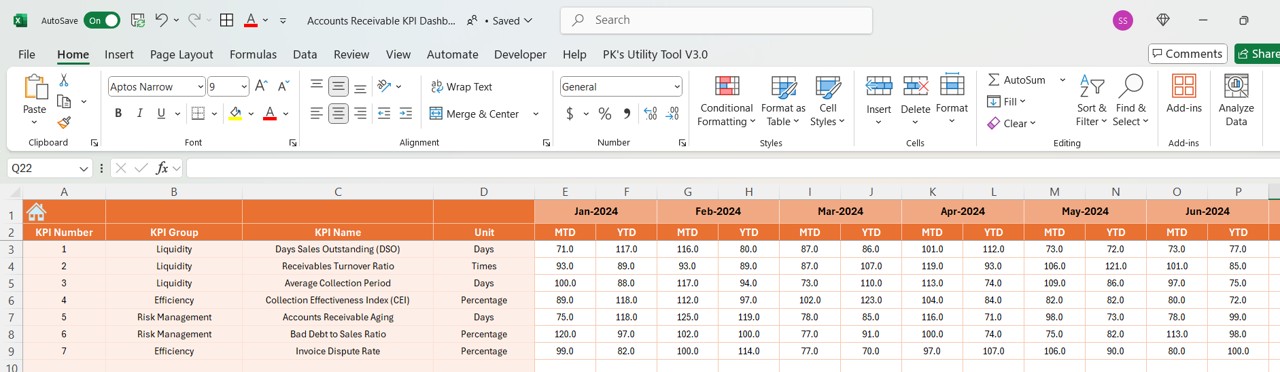
4. Actual Number Sheet Tab
The Actual Number Sheet Tab allows users to input actual values for both MTD and YTD numbers for a specific month. Users can change the month by updating the value in E1, and the data will be updated accordingly.
Click to buy Accounts Receivable KPI Dashboard in Excel
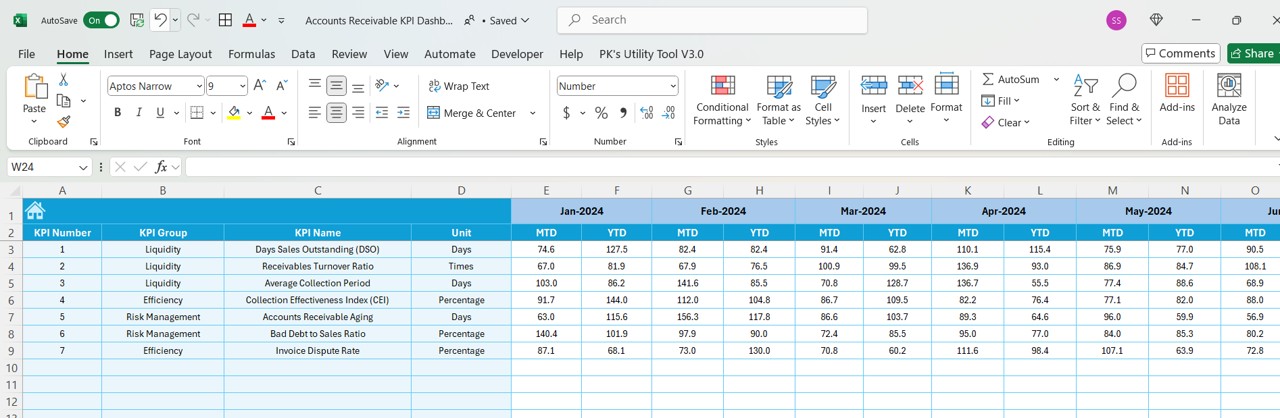
5. Target Sheet Tab
In this sheet, users input the target values for each KPI for a specific month. Both MTD and YTD targets should be filled in.
Click to buy Accounts Receivable KPI Dashboard in Excel
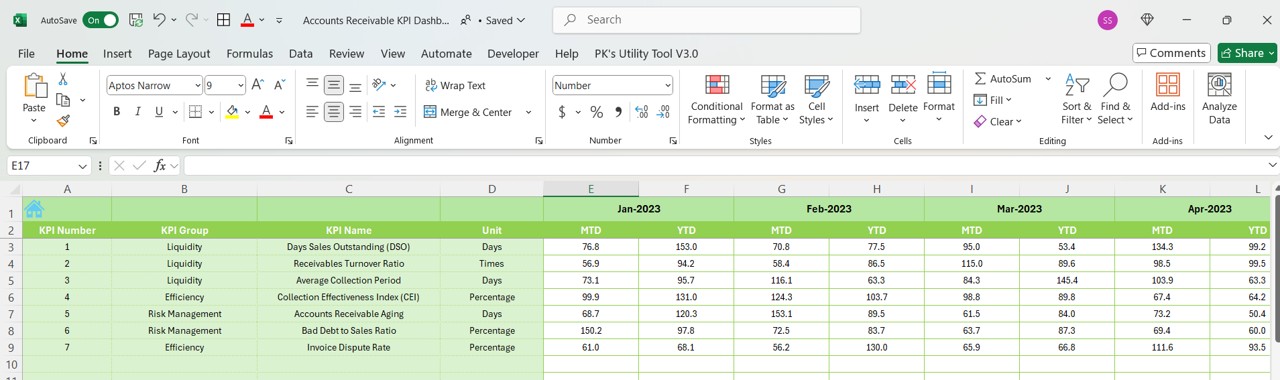
6. Previous Year Number Sheet Tab
The Previous Year Number Sheet Tab stores the same values as the Actual Number Sheet but for the previous year. This allows users to compare the current year’s performance with the previous year’s figures.
Click to buy Accounts Receivable KPI Dashboard in Excel
7. KPI Definition Sheet Tab
Advantages of the Accounts Receivable KPI Dashboard
The Accounts Receivable KPI Dashboard provides businesses with numerous benefits, including:
- Enhanced Visibility: The dashboard allows users to see all the important metrics in one place. It offers a clear, visual representation of key data, making it easier to spot trends and take necessary actions.
- Real-Time Data: The dashboard updates automatically as new data is entered, ensuring that the information displayed is always up-to-date. This helps businesses make timely decisions based on current data.
- Increased Efficiency: By tracking KPIs in real-time, businesses can identify issues quickly and address them before they escalate. This leads to improved cash flow and better management of accounts receivable.
- Improved Decision-Making: The dashboard provides actionable insights, enabling businesses to make more informed decisions regarding collections, payment terms, and customer management.
Opportunities for Improvement in the Accounts Receivable KPI Dashboard
While the Accounts Receivable KPI Dashboard is a powerful tool, there are always opportunities to enhance its functionality:
- Integration with Other Financial Tools: Integrating the dashboard with other financial systems, such as accounting software or ERP systems, could provide a more comprehensive view of a company’s financial health.
- Predictive Analytics: By incorporating machine learning or predictive analytics, the dashboard could offer forecasting capabilities to predict future receivables trends, helping businesses make more proactive decisions.
- Mobile Accessibility: Ensuring that the dashboard is accessible on mobile devices would allow finance teams to monitor their accounts receivable performance on the go.
Best Practices for Using the Accounts Receivable KPI Dashboard
To maximize the effectiveness of the Accounts Receivable KPI Dashboard, here are some best practices:
- Update Data Regularly: Ensure that both the actual numbers and target values are updated regularly to keep the dashboard accurate and useful.
- Focus on Key KPIs: Track only the most relevant KPIs for your business. Not every KPI is crucial for every organization, so focus on the ones that impact your receivables the most.
- Leverage Conditional Formatting: Use conditional formatting to highlight areas of concern (e.g., overdue invoices or KPIs that are consistently below target) for immediate action.
- Share with Key Stakeholders: Ensure that the dashboard is accessible to relevant stakeholders, such as the finance team and management, so they can make informed decisions.
Conclusion
The Accounts Receivable KPI Dashboard is an indispensable tool for businesses looking to optimize their cash flow management. By providing a clear view of key receivables metrics, this dashboard helps businesses track performance, identify issues, and make data-driven decisions to improve financial health.
Frequently Asked Questions (FAQs)
1. What KPIs are tracked in the Accounts Receivable KPI Dashboard?
The dashboard tracks several key KPIs, including Days Sales Outstanding (DSO), Receivables Turnover Ratio, Bad Debt to Sales Ratio, and others.
2. How do I update the data in the Accounts Receivable KPI Dashboard?
The data can be updated by filling in the appropriate figures in the Excel worksheets (Actual, Target, Previous Year, and KPI Definition sheets).
3. Can the dashboard be customized for my business?
Yes, the dashboard is highly customizable. You can adjust the KPIs, targets, and layout to suit your specific business needs.
4. Is the dashboard suitable for small businesses?
Yes, the dashboard is scalable and can be adapted to businesses of all sizes, including small businesses, to track their receivables efficiently.
Visit our YouTube channel to learn step-by-step video tutorials
View this post on Instagram
Click to buy Accounts Receivable KPI Dashboard in Excel