In the world of recruitment, keeping track of performance metrics is essential for optimizing hiring strategies and improving overall outcomes. A Recruitment KPI Dashboard in Power BI offers an advanced, interactive tool to monitor and analyze key performance indicators (KPIs) in real time. By leveraging Power BI’s powerful capabilities, this dashboard can help businesses track recruitment performance and drive decisions that lead to improved hiring processes.
In this article, we’ll explore the key features of the Recruitment KPI Dashboard in Power BI, discuss its benefits, provide best practices for using it, and highlight opportunities for improvement. We’ll also answer some frequently asked questions (FAQs) to help you make the most of this valuable tool.
What is a Recruitment KPI Dashboard?
A Recruitment KPI Dashboard is a data visualization tool designed to track and assess key recruitment metrics in an organization. The dashboard provides insights into various performance indicators, such as time-to-fill, candidate quality, and cost-per-hire, among others. With the help of Power BI, businesses can collect, analyze, and present recruitment data in a visually compelling and easy-to-understand format.
The Recruitment KPI Dashboard in Power BI integrates seamlessly with data from various sources, including Excel, to provide up-to-date, actionable insights that can inform recruitment decisions.
Key Features of the Recruitment KPI Dashboard in Power BI
The Recruitment KPI Dashboard in Power BI comes with several features that allow you to monitor and analyze your recruitment performance effectively. Let’s take a closer look at the main components of this dashboard.
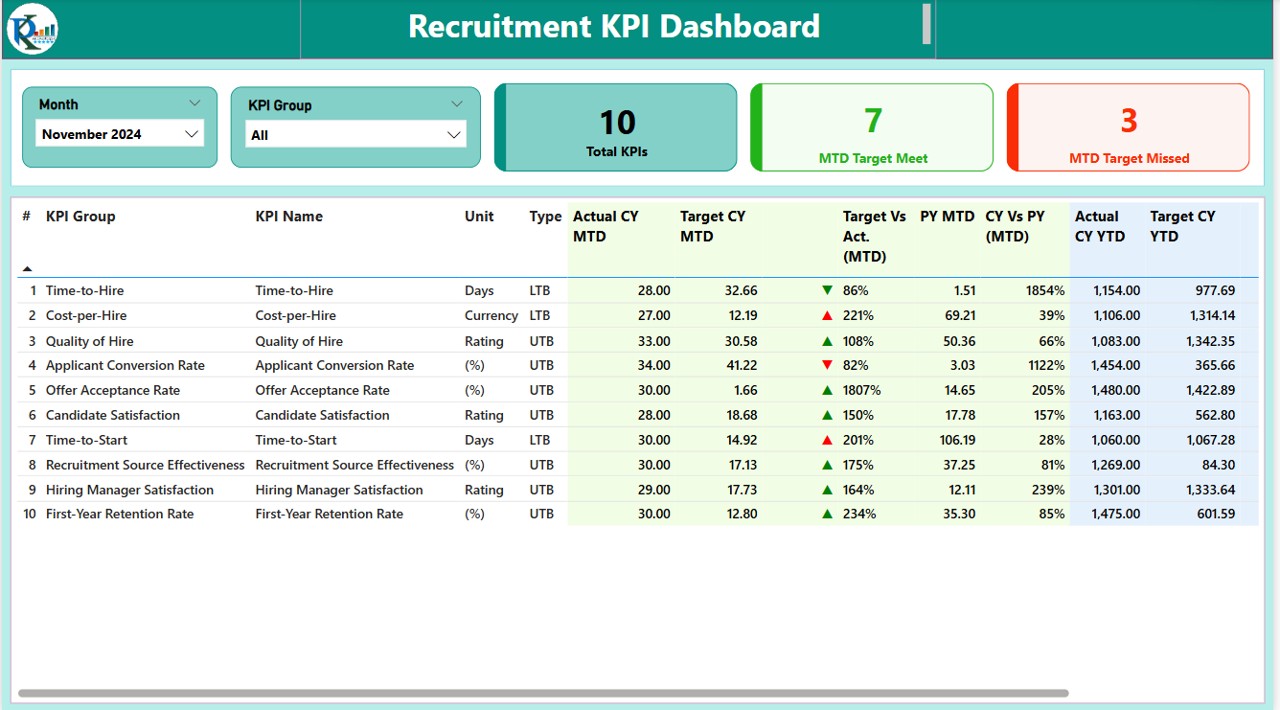
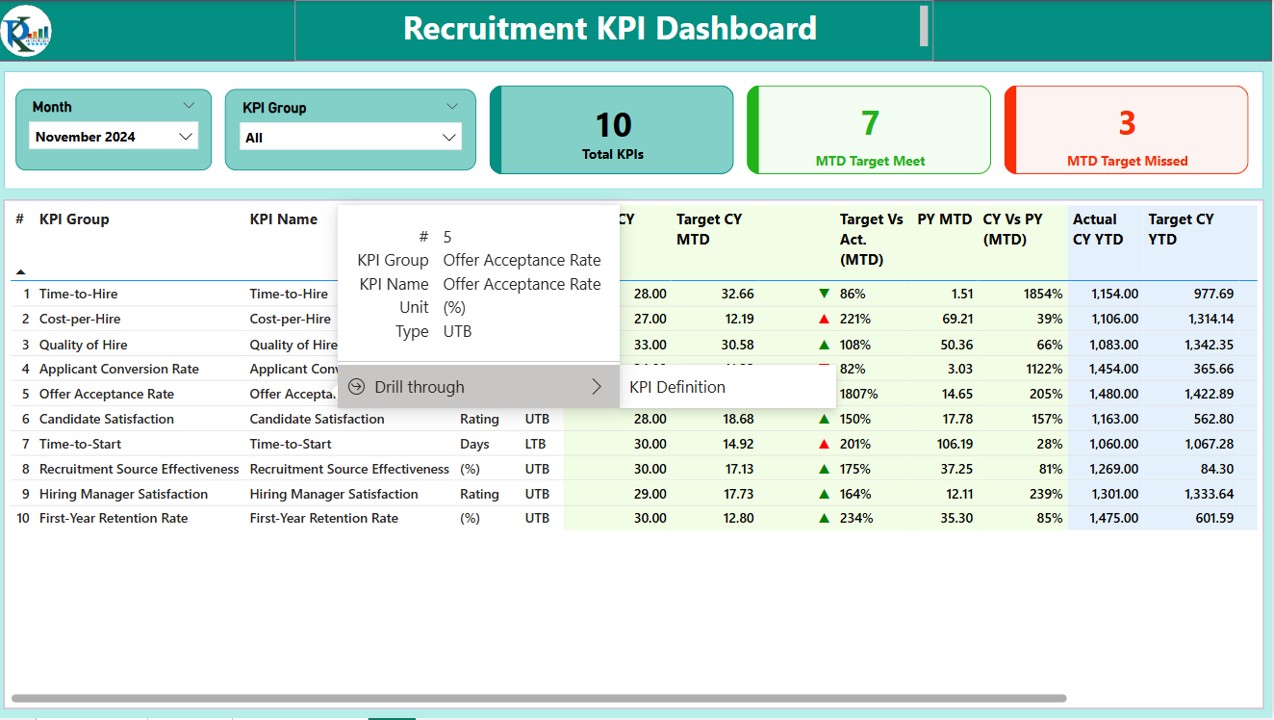
1. Summary Page: Overview of Recruitment KPIs
The Summary Page serves as the main hub for viewing all key recruitment data at a glance. This page is interactive and provides a range of important recruitment KPIs, such as:
- Month and KPI Group Slicers: The slicers on the top allow you to filter the data by month and KPI group, giving you the flexibility to view recruitment performance by specific time periods or categories.
- Total KPIs Count: This card shows the total number of KPIs being tracked, giving you an overview of all the metrics in your recruitment process.
- MTD (Month-to-Date) Target Meet and Missed Counts: These cards show how many KPIs have met or missed their targets for the current month. This provides a quick snapshot of how well your recruitment team is performing.
Below the summary section, there is a detailed table that contains several important columns:
- KPI Number: The sequence number of each KPI.
- KPI Group: The category or group of the KPI (e.g., time-based, cost-based).
- KPI Name: The name of the specific KPI (e.g., time-to-fill, cost-per-hire).
- Unit: The unit of measurement used for each KPI (e.g., percentage, number of candidates).
- Type (LTB or UTB): Whether the KPI is a “Lower the Better” (LTB) or “Upper the Better” (UTB) type.
- Actual CY MTD and Target CY MTD: These columns show the current year’s actual numbers and target numbers for month-to-date (MTD) performance.
- MTD Icon: Conditional formatting with red (▼) and green (▲) icons indicates whether the KPI is meeting or missing its target.
- Target Vs Actual (MTD): This percentage calculation shows how close the actual performance is to the target.
- PY MTD and CY Vs PY (MTD): A comparison of the current MTD with the previous year’s MTD to assess performance over time.
- Actual CY YTD and Target CY YTD: These columns show the current year’s actual numbers and target numbers for year-to-date (YTD) performance.
- YTD Icon: Similar to the MTD icon, this shows the status of the YTD performance using red or green arrows.
Click to buy Recruitment KPI Dashboard in Power BI
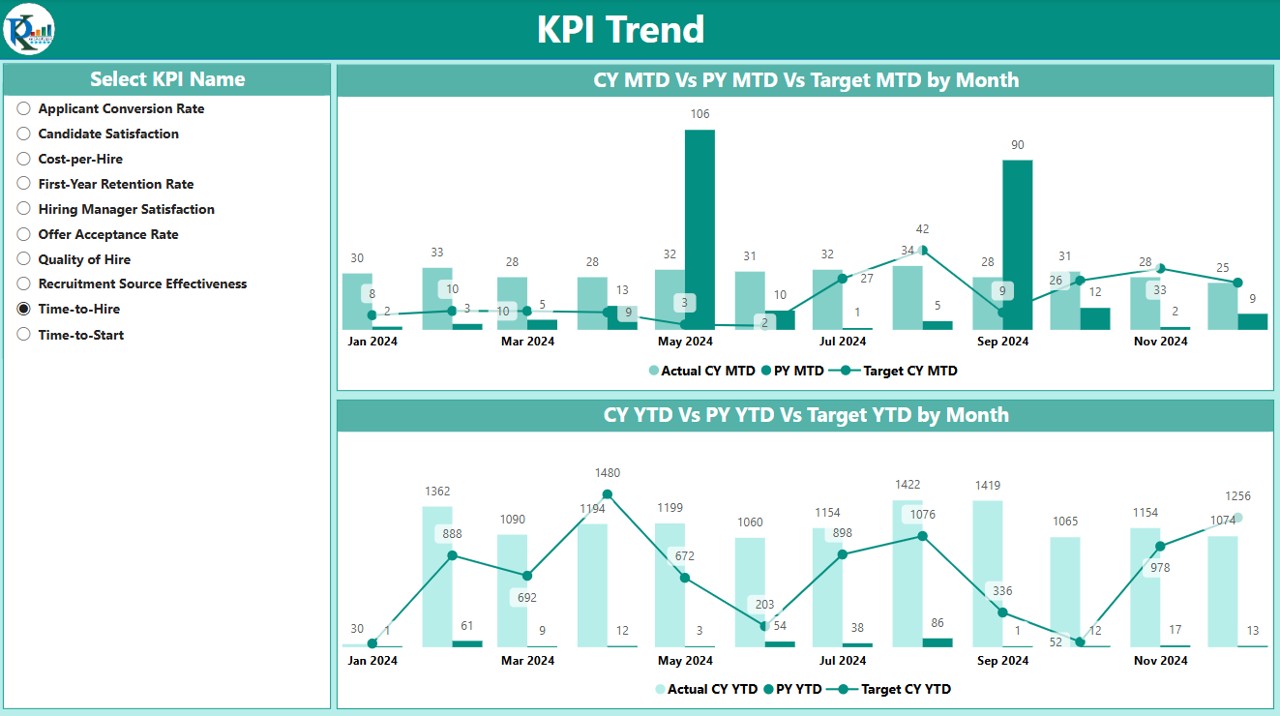
2. KPI Trend Page: Visualizing Recruitment Performance
The KPI Trend Page is designed to show the performance trends of your KPIs over time. It provides two combo charts that display:
- Actual Numbers: The current year’s actual performance.
- Previous Year Numbers: The previous year’s performance for comparison.
- Targets: The recruitment targets set for the current year, allowing you to assess performance against predefined goals.
These combo charts offer a visual representation of how your recruitment KPIs are performing, making it easy to spot trends, identify areas for improvement, and celebrate successes.
Click to buy Recruitment KPI Dashboard in Power BI
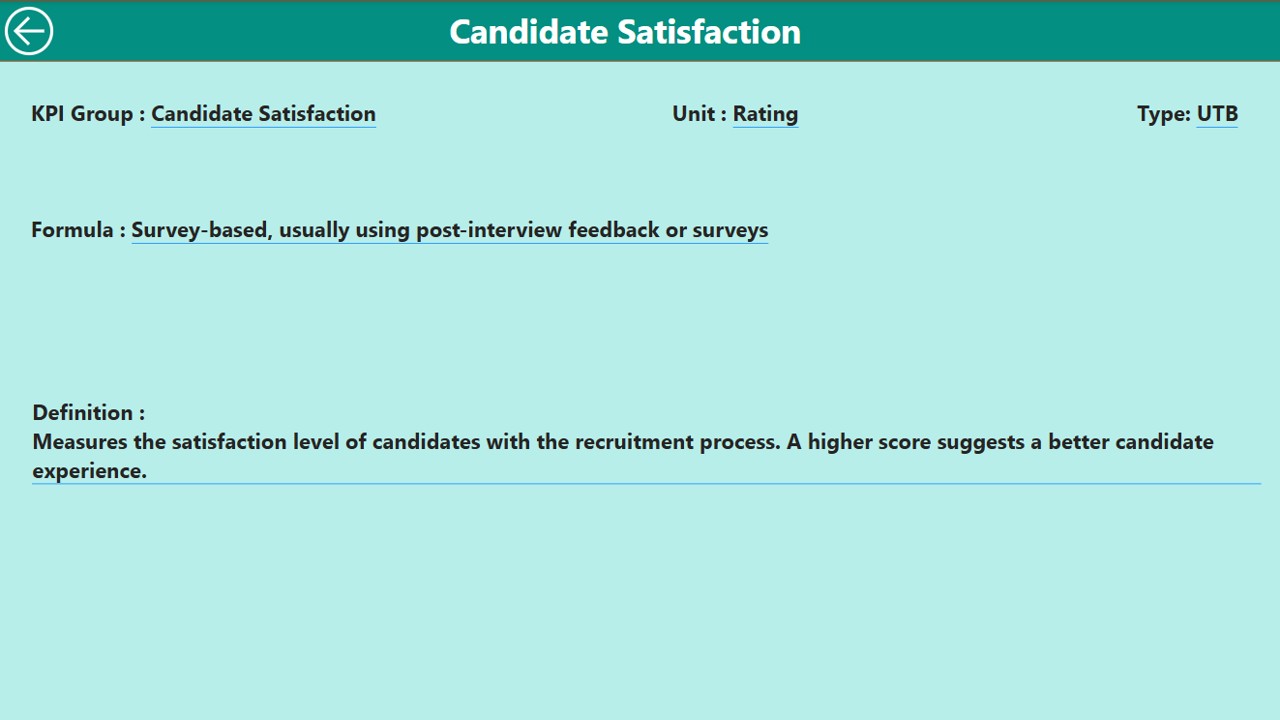
3. KPI Definition Page: Understanding the Details of Each KPI
The KPI Definition Page provides in-depth details about each KPI, including:
Click to buy Recruitment KPI Dashboard in Power BI
- Formula: The formula used to calculate each KPI.
- KPI Definition: A clear explanation of what the KPI measures and why it’s important for recruitment performance.
This page is a drill-through page, meaning that you can access it from the summary page to get a deeper understanding of each metric’s context and formula. It allows users to learn more about how each KPI is calculated and what it reflects about the recruitment process.
Click to buy Recruitment KPI Dashboard in Power BI
Data Source Integration: Using Excel as a Data Source
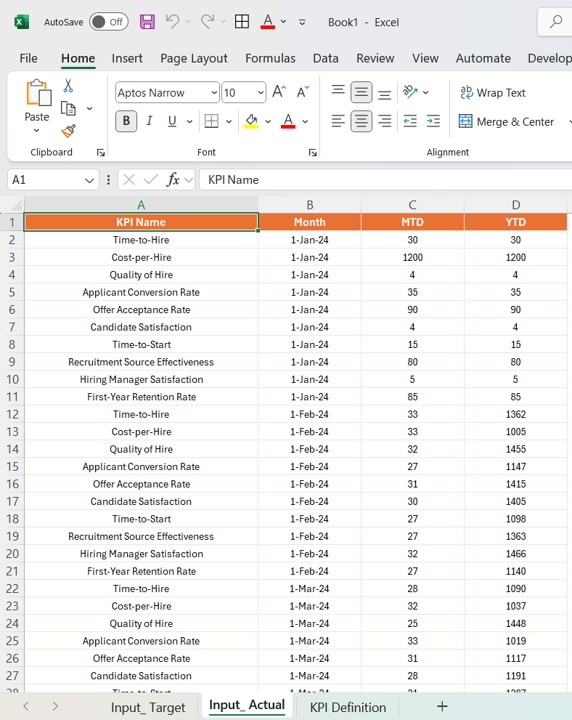
The Recruitment KPI Dashboard in Power BI uses Excel as its data source. This provides an easy way to import recruitment data from multiple sources. The Excel file consists of three key sheets:
Input_Actual Sheet Tab: Enter the actual numbers for each KPI, month, MTD, and YTD.
Click to buy Recruitment KPI Dashboard in Power BI
- Input_Target Sheet Tab: Input the target numbers for each KPI, month, MTD, and YTD.
- KPI Definition Sheet Tab: Fill in the KPI details, including the number, group, name, unit, formula, definition, and type (LTB or UTB).
Advantages of the Recruitment KPI Dashboard in Power BI
- Real-Time Insights: The dashboard allows recruitment teams to monitor KPIs in real-time, providing up-to-date insights that drive timely decision-making.
- Customizable Views: The slicers and filters make it easy to view performance by month, KPI group, or specific KPIs, giving users the flexibility to customize the view according to their needs.
- Historical Comparisons: The ability to compare the current year’s performance against the previous year’s data allows businesses to track progress over time and identify long-term trends.
- Improved Decision-Making: By having clear, accessible data in one place, businesses can make informed decisions that optimize their recruitment strategies.
- Interactive Visualizations: Power BI’s interactive charts and tables make it easy for users to explore data and gain deeper insights without feeling overwhelmed.
Opportunities to Improve the Recruitment KPI Dashboard
While the Recruitment KPI Dashboard in Power BI is an excellent tool for tracking recruitment performance, there are always areas for improvement:
- Integration with Other Recruitment Tools: Consider integrating the dashboard with other HR or recruitment software for seamless data synchronization.
- Automation of Data Entry: Automating data entry processes can reduce manual input errors and ensure that the dashboard is always populated with accurate and up-to-date information.
- Advanced Analytics: Incorporate machine learning or predictive analytics to forecast future recruitment performance and trends based on historical data.
- Mobile Access: Ensure the dashboard is accessible on mobile devices for on-the-go access, especially for recruitment teams working remotely.
Best Practices for Using the Recruitment KPI Dashboard
To get the most out of the Recruitment KPI Dashboard, follow these best practices:
- Regularly Update Data: Keep your data current by updating the Excel file with the latest numbers for MTD, YTD, and targets.
- Review KPIs Frequently: Regularly review KPIs to ensure that the recruitment process is aligned with organizational goals and that performance is on track.
- Use Conditional Formatting: Leverage the dashboard’s built-in conditional formatting to quickly identify KPIs that are underperforming and take corrective action.
- Set Clear Targets: Ensure that KPIs have clear, achievable targets that align with business objectives, and use the dashboard to track progress toward these goals.
- Collaborate with the Team: Share the dashboard with key stakeholders, including HR and recruitment managers, to ensure alignment and foster collaboration.
Frequently Asked Questions (FAQs)
What is a Recruitment KPI Dashboard in Power BI?
A Recruitment KPI Dashboard in Power BI is a tool that helps recruitment teams track, analyze, and visualize key performance indicators (KPIs) related to the recruitment process.
How can I use the Recruitment KPI Dashboard to improve hiring performance?
By tracking metrics like time-to-fill, cost-per-hire, and candidate quality, the dashboard helps you identify inefficiencies, improve decision-making, and optimize your recruitment strategy.
Can I customize the KPIs on the dashboard?
Yes, the Recruitment KPI Dashboard can be customized to fit your specific recruitment goals and the KPIs that matter most to your organization.
Is it possible to integrate other tools with the Recruitment KPI Dashboard?
Yes, integrating the dashboard with other recruitment or HR tools can help streamline data flow and improve the accuracy of your insights.
How do I update the data in the Recruitment KPI Dashboard?
You can update the data by editing the Input_ Actual and Input_ Target sheets in the Excel file, which will automatically update the dashboard in Power BI.
Conclusion
The Recruitment KPI Dashboard in Power BI is a powerful tool that helps organizations track and analyze recruitment performance in real-time. By offering insights into key KPIs like time-to-fill, candidate quality, and cost-per-hire, this dashboard empowers HR teams to make data-driven decisions that optimize the recruitment process. With its interactive visualizations, real-time updates, and customizable features, it’s an essential tool for any organization looking to improve its recruitment strategies.
Visit our YouTube channel to learn step-by-step video tutorials
Click to buy Recruitment KPI Dashboard in Power BI