In today’s competitive market, customer retention is crucial for business success. Companies that focus on keeping their customers satisfied, rather than constantly acquiring new ones, often see higher profitability and long-term growth. One of the best ways to track and optimize customer retention is through the use of a Customer Retention KPI Dashboard in Power BI. This dashboard not only allows you to monitor key performance indicators (KPIs) in real-time but also helps you gain actionable insights into how your customer base is performing.
This article will explore how to effectively build and use a Customer Retention KPI Dashboard in Power BI, highlighting its features, advantages, and best practices. We will dive into the components of the dashboard, its functionality, and how it helps businesses improve customer loyalty through data-driven decisions.
What is a Customer Retention KPI Dashboard?
A Customer Retention KPI Dashboard is a business intelligence tool used to monitor the success of your customer retention strategies. It provides a visual representation of how well a company is retaining its customers over time. By analyzing key metrics, such as customer churn, repeat purchase rate, and customer lifetime value, businesses can gauge the effectiveness of their customer retention programs.
A Power BI-based dashboard integrates data from various sources, offering dynamic and interactive visualizations that empower decision-makers to track trends, identify issues, and take corrective actions in real-time.
Key Features of the Customer Retention KPI Dashboard
The Customer Retention KPI Dashboard is designed to provide comprehensive insights into the performance of your customer retention efforts. Below are the key features that make it a powerful tool for businesses.
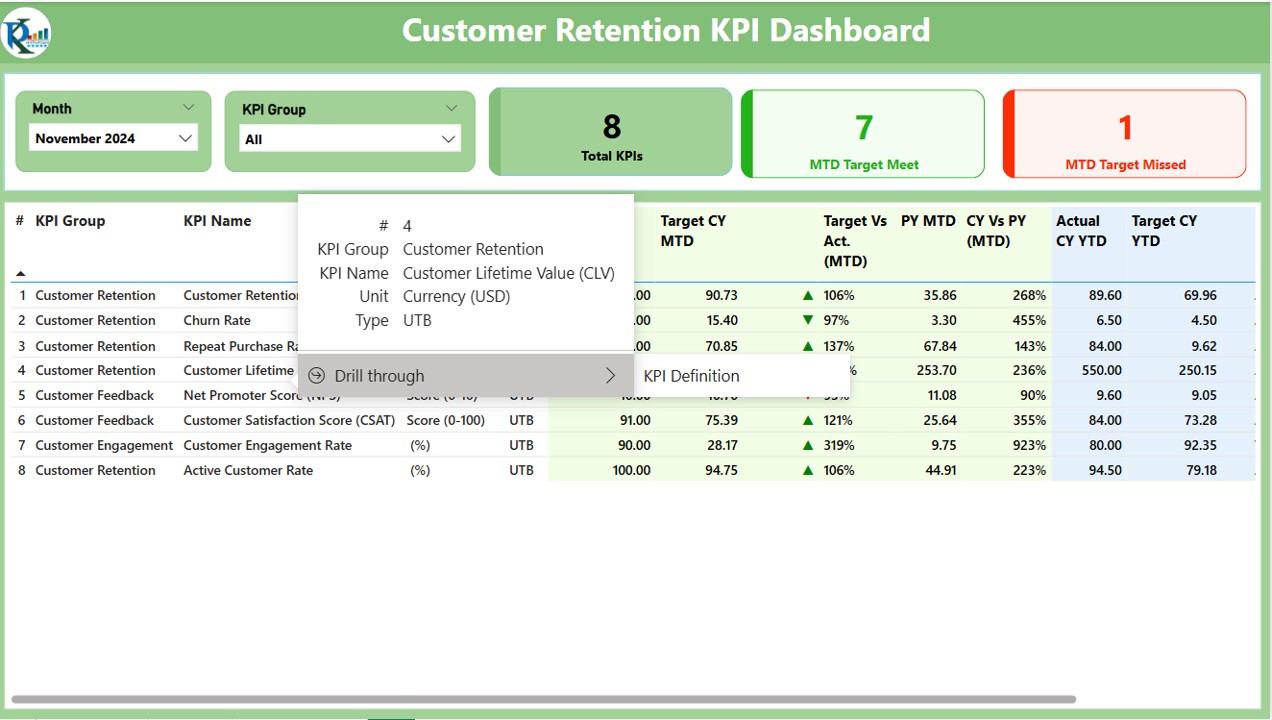
1. Summary Page
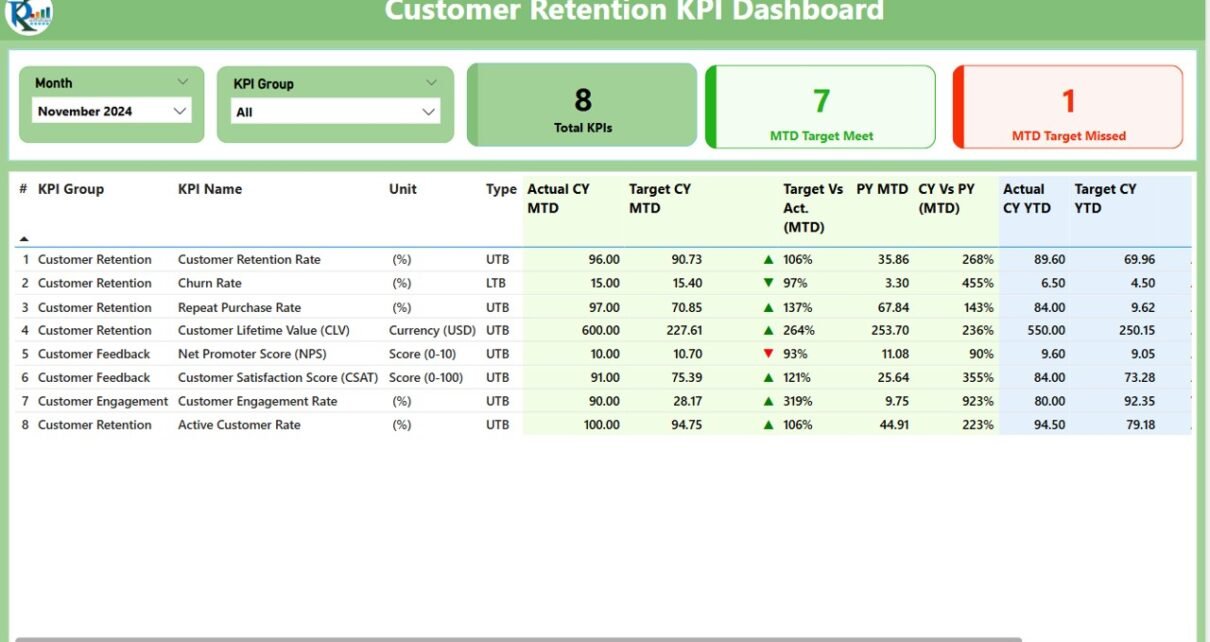
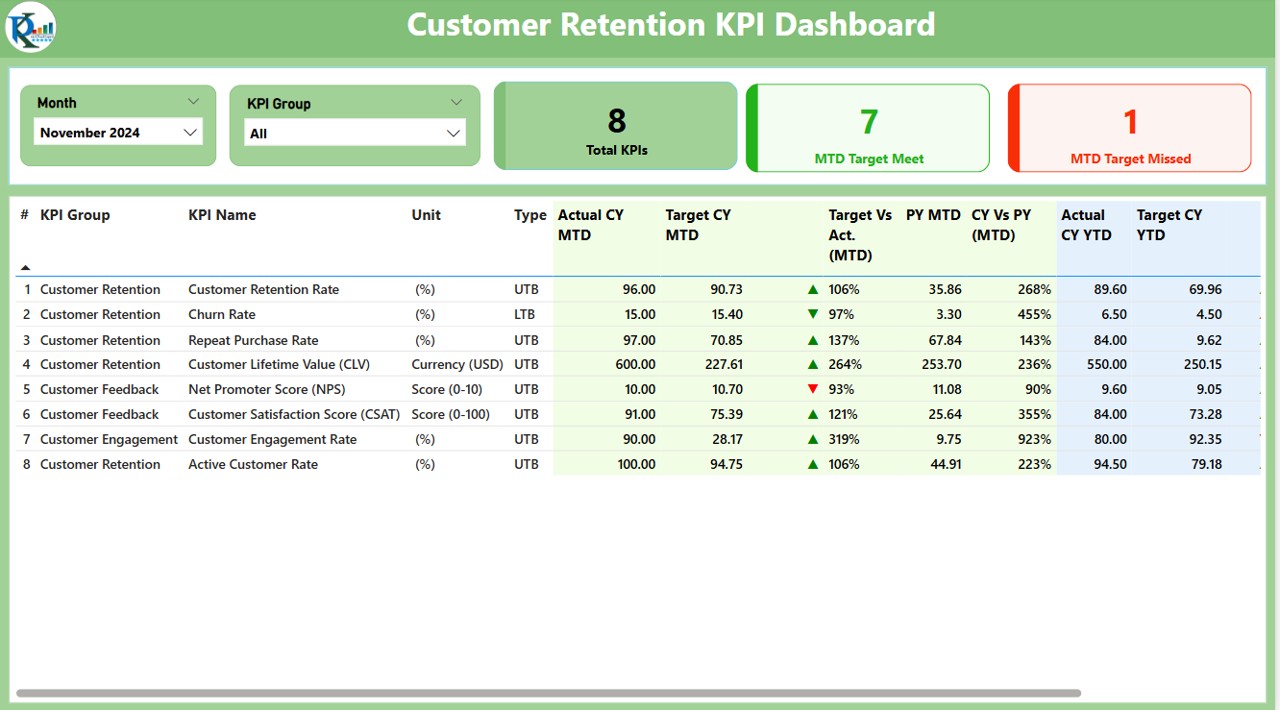
The Summary Page serves as the main dashboard for reviewing customer retention KPIs. This page provides a snapshot of the key performance indicators (KPIs) and allows users to interact with the data using slicers.
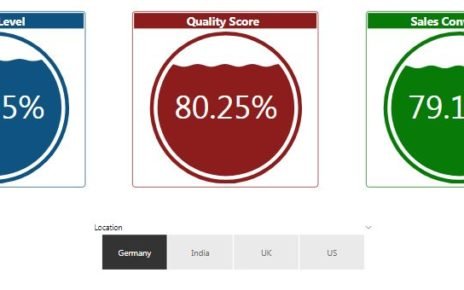
Month and KPI Group Slicers: These slicers allow users to filter the data by month and KPI group, enabling them to analyze specific periods and categories of KPIs.
KPI Status Cards: This feature displays three cards showing:
- Total KPIs Count
- MTD Target Meet Count
- MTD Target Missed Count
Detailed KPI Table: The table on this page provides an in-depth look at each KPI, including:
- KPI Number
- KPI Group
- KPI Name
- Unit of Measurement
- Type (LTB or UTB)
- Actual CY MTD and Target CY MTD
- MTD Icons: Green and Red arrows indicate if targets are met or missed for MTD (Month to Date) values.
- Target vs. Actual MTD Percentage
- CY Vs. PY (MTD) Comparison
Click to buy Customer Retention KPI Dashboard in Power BI
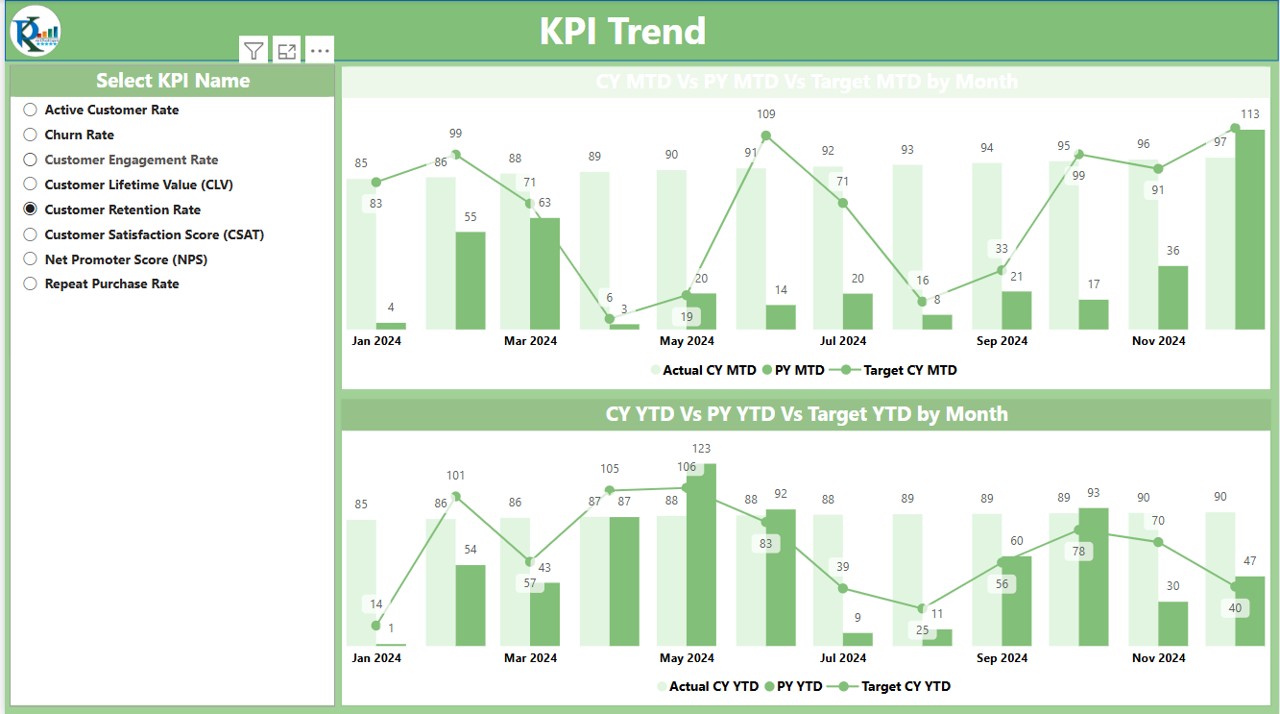
2. KPI Trend Page
The KPI Trend Page is designed to show the historical performance of customer retention KPIs. It includes two combo charts that display:
- Actual Numbers for the current year, previous year, and targets for MTD (Month to Date) and YTD (Year to Date).
- A slicer to select specific KPIs to visualize, making it easier for users to focus on the metrics that matter most to them.
Click to buy Customer Retention KPI Dashboard in Power BI
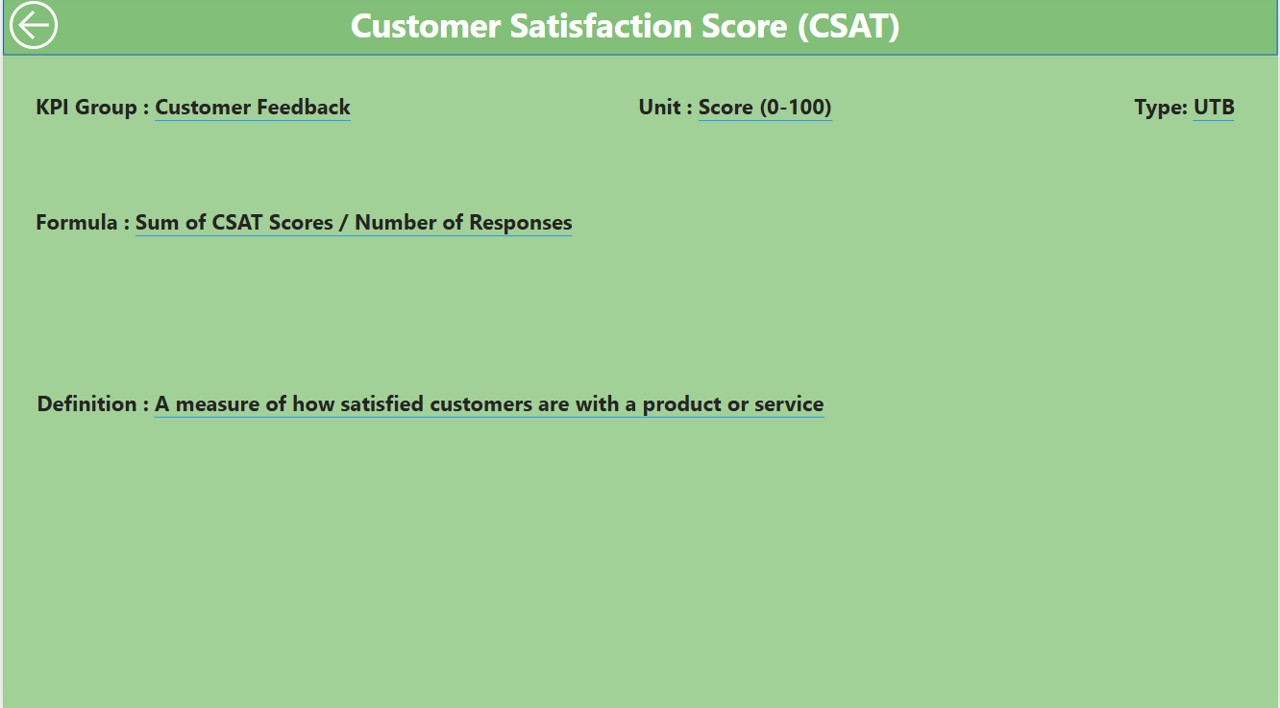
3. KPI Definition Page
The KPI Definition Page is a hidden drill-through page that offers detailed definitions of the KPIs used in the dashboard. Users can click on a KPI in the Summary Page to view its full details, including:
Click to buy Customer Retention KPI Dashboard in Power BI
- The formula used to calculate the KPI.
- The definition and significance of the KPI.
- The type of KPI (whether it’s “Lower the Better” or “Upper the Better”).
The drill-through page provides a deeper understanding of each KPI, helping users make more informed decisions.
Click to buy Customer Retention KPI Dashboard in Power BI
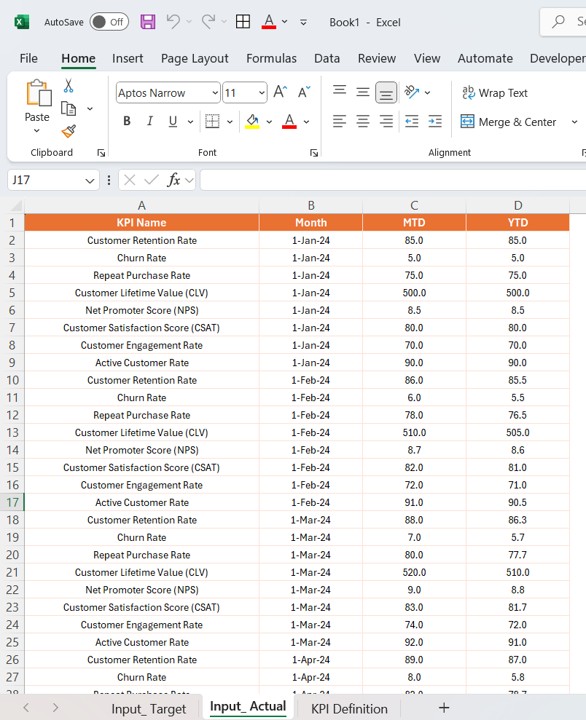
Excel Data: The Backbone of Your Dashboard
The dashboard pulls data from an Excel file that you need to update regularly. The Excel file consists of three key worksheets:
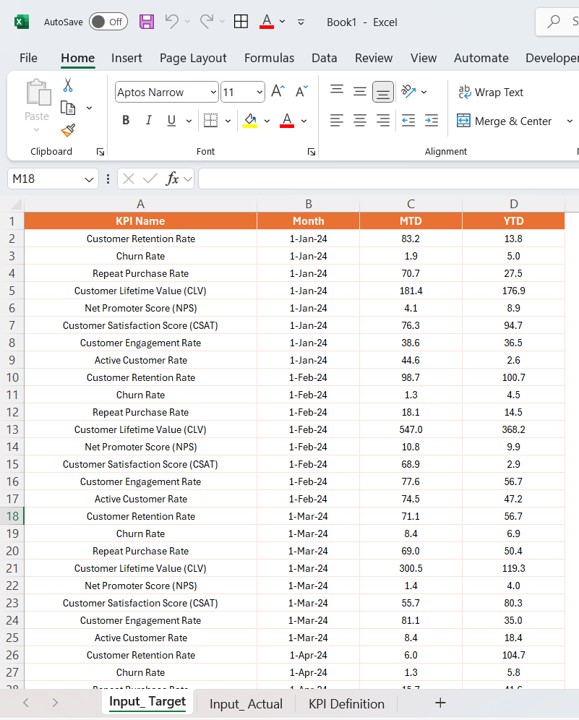
Input_Actual Sheet Tab: This sheet contains the actual performance data for each KPI, including:
- KPI Name
- Month (using the first date of the month)
- MTD (Month to Date) Numbers
- YTD (Year to Date) Numbers
Click to buy Customer Retention KPI Dashboard in Power BI
Input_Target Sheet Tab: This sheet contains the target values for each KPI, similar to the data in the Input_Actual Sheet Tab.
Click to buy Customer Retention KPI Dashboard in Power BI
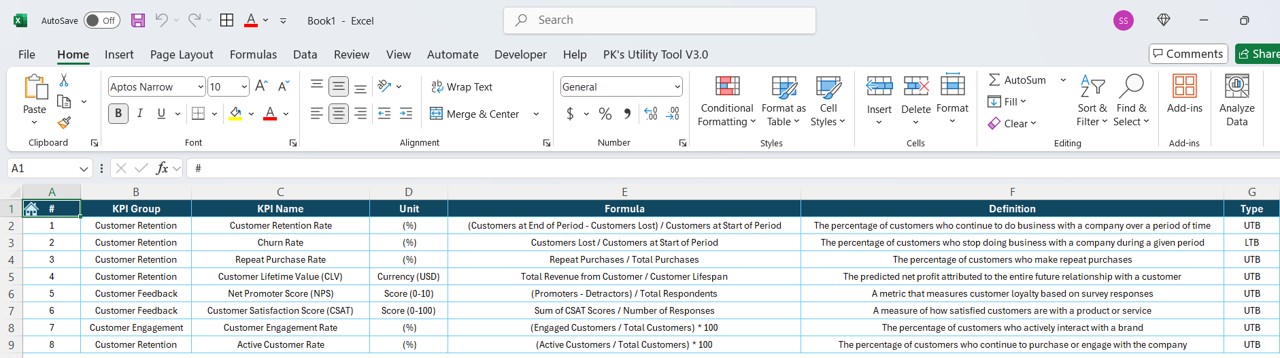
KPI Definition Sheet Tab: This sheet includes essential metadata about the KPIs, such as:
- KPI Number
- KPI Group
- KPI Name
- Unit of Measurement
- Formula and Definition
- Type (LTB or UTB)
The Excel file needs to be filled with accurate and up-to-date data for the Power BI dashboard to function properly.
Click to buy Customer Retention KPI Dashboard in Power BI
Advantages of a Customer Retention KPI Dashboard in Power BI
There are several advantages to using a Customer Retention KPI Dashboard powered by Power BI. Below are some of the key benefits:
- Real-Time Monitoring: One of the most significant advantages of using Power BI is its ability to provide real-time updates on customer retention performance. You no longer have to rely on outdated reports or wait until the end of the month to assess how your retention strategies are working. The dashboard offers continuous insights, allowing you to take immediate action if any issues arise.
- Easy Data Visualization: Power BI’s powerful data visualization tools allow businesses to see customer retention KPIs in a way that is easy to understand. Visualizing data in charts, tables, and graphs helps decision-makers spot trends, outliers, and areas that require improvement.
- Improved Decision-Making: With data readily available at your fingertips, business leaders can make faster, more informed decisions. Instead of relying on gut feelings or assumptions, the dashboard offers solid data-backed insights that guide strategic decisions.
- Customizable Reports: Power BI dashboards are highly customizable. You can tailor the dashboard’s layout, visuals, and KPIs to match your specific business needs. Whether you want to track customer churn, retention rates, or customer lifetime value, Power BI offers flexibility to design the dashboard to your exact specifications.
- Accessibility and Sharing: Power BI dashboards are cloud-based, which means they can be accessed from anywhere, on any device. Additionally, Power BI makes it easy to share the dashboard with team members, stakeholders, or management, ensuring everyone is on the same page when it comes to customer retention goals.
Opportunities for Improvement in the Customer Retention KPI Dashboard
Although the Customer Retention KPI Dashboard offers powerful features, there are always opportunities to improve. Below are a few suggestions:
- Enhanced Predictive Analytics: While the current dashboard provides valuable historical insights, integrating predictive analytics could further enhance its capabilities. By using machine learning algorithms, businesses could forecast customer retention trends and identify potential risks before they become significant problems.
- Cross-Platform Integration: The ability to integrate the dashboard with other platforms, such as CRM software or marketing automation tools, would provide a more holistic view of the customer journey. This would allow businesses to track customer retention alongside acquisition and engagement metrics, offering a more comprehensive picture of customer behavior.
- Automation of Data Updates: While the Excel file serves as the data source, automating the process of data updates could save time and reduce human error. By integrating Power BI with an automated data pipeline, businesses could ensure that the dashboard always reflects the most recent data without requiring manual intervention.
Best Practices for Using a Customer Retention KPI Dashboard
To maximize the effectiveness of your Customer Retention KPI Dashboard, here are some best practices to follow:
- Regularly Update Your Data: Ensure that the data in your Excel file is updated regularly. This will allow the Power BI dashboard to display the most accurate and up-to-date information. Set a routine for updating the data to avoid discrepancies in the reports.
- Focus on the Right KPIs: Choosing the right KPIs to track is essential for success. Customer retention KPIs such as churn rate, repeat purchase rate, and customer lifetime value should be prioritized, as they directly impact your business’s long-term success.
- Use Visuals to Tell a Story: Visualizing customer retention data in different formats (charts, graphs, tables) helps tell a more compelling story. This makes it easier for stakeholders to understand the data and take action.
- Set Clear Goals: Define clear customer retention goals and track progress towards them using the dashboard. This will help ensure that your efforts are aligned with overall business objectives and that the team remains focused on the most important metrics.
Frequently Asked Questions (FAQs)
1. What KPIs should I track for customer retention?
Some of the most important KPIs for tracking customer retention include:
- Customer Churn Rate
- Repeat Purchase Rate
- Customer Lifetime Value (CLV)
- Net Promoter Score (NPS)
- Customer Satisfaction (CSAT)
2. How often should I update the data in the dashboard?
Ideally, you should update the data on a monthly or quarterly basis to ensure that the dashboard reflects the most accurate information. This helps in making informed decisions quickly.
3. Can I integrate the Power BI dashboard with other tools?
Yes, Power BI allows integration with various tools such as CRM software, marketing platforms, and other business intelligence systems, providing a more comprehensive view of customer retention.
4. Is Power BI suitable for small businesses?
Yes, Power BI is a versatile tool that can be used by businesses of all sizes. Its ease of use and scalability make it an ideal choice for small businesses looking to track and improve customer retention.
Conclusion
In conclusion, a Customer Retention KPI Dashboard in Power BI is an essential tool for businesses looking to improve their customer retention strategies. It allows for real-time monitoring, customizable reporting, and improved decision-making. By leveraging the advantages of this powerful tool, businesses can gain valuable insights into their customer base and make informed decisions that foster long-term loyalty.
Visit our YouTube channel to learn step-by-step video tutorials