
In the world of investing, keeping track of your portfolio’s performance is crucial. Whether you’re an individual investor or managing investments for an organization, knowing how your assets are performing relative to your expectations and the broader market can help you make smarter decisions. One of the best ways to track this performance is through a Portfolio Performance KPI Dashboard.
A Portfolio Performance KPI (Key Performance Indicator) Dashboard aggregates various performance metrics, making it easier to track the health of your investments. By measuring things like return rates, volatility, and asset allocations, this dashboard can help investors optimize their portfolios to achieve better results. In this article, we will delve deep into the Portfolio Performance KPI Dashboard, discussing its features, advantages, opportunities for improvement, and best practices.
What is a Portfolio Performance KPI Dashboard?
A Portfolio Performance KPI Dashboard is a tool used to track and visualize the performance of a portfolio, which could be a mix of stocks, bonds, mutual funds, or any other financial assets. This dashboard includes a series of KPIs that provide investors with insights into how their investments are performing, allowing them to make data-driven decisions. By comparing actual performance against targets and benchmarks, investors can assess their strategies and adjust accordingly.
The dashboard typically includes various metrics such as portfolio returns, risk-adjusted returns, asset allocations, and volatility, all of which help in understanding the portfolio’s risk-return profile. With easy-to-read visuals and real-time updates, the dashboard allows investors to see trends over time and make necessary adjustments to their investment strategies.
Key Features of the Portfolio Performance KPI Dashboard
The Portfolio Performance KPI Dashboard is an essential tool for tracking key investment metrics. The template includes seven core worksheets, each designed to provide users with specific insights into their portfolio’s performance. Below are the features and functionalities of each worksheet:
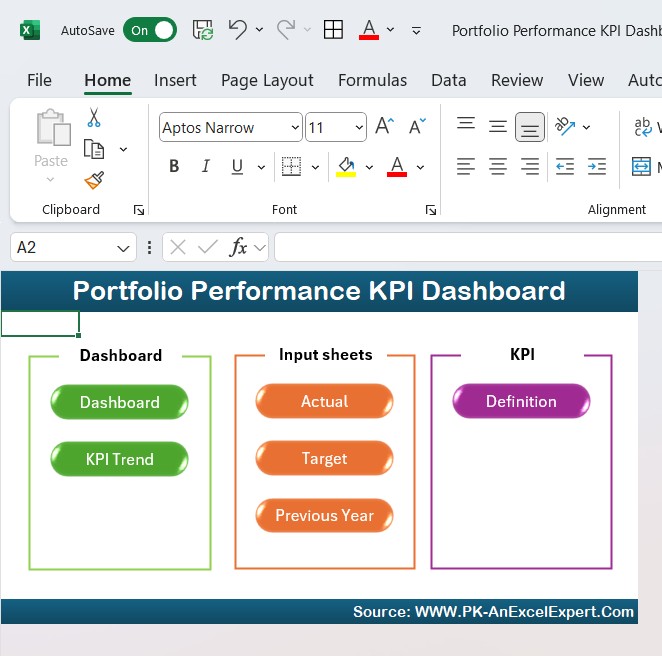
1. Home Sheet: Central Hub for Easy Navigation
The Home Sheet serves as the main index page, providing quick access to all the other worksheets in the template. It contains six buttons that link directly to the following sheets:
- Dashboard Sheet
- KPI Trend Sheet
- Actual Number Sheet
- Target Sheet
- Previous Year Number Sheet
- KPI Definition Sheet
This sheet ensures that users can easily navigate through the dashboard without having to search for the information manually.
Click to buy Portfolio Performance KPI Dashboard in Excel
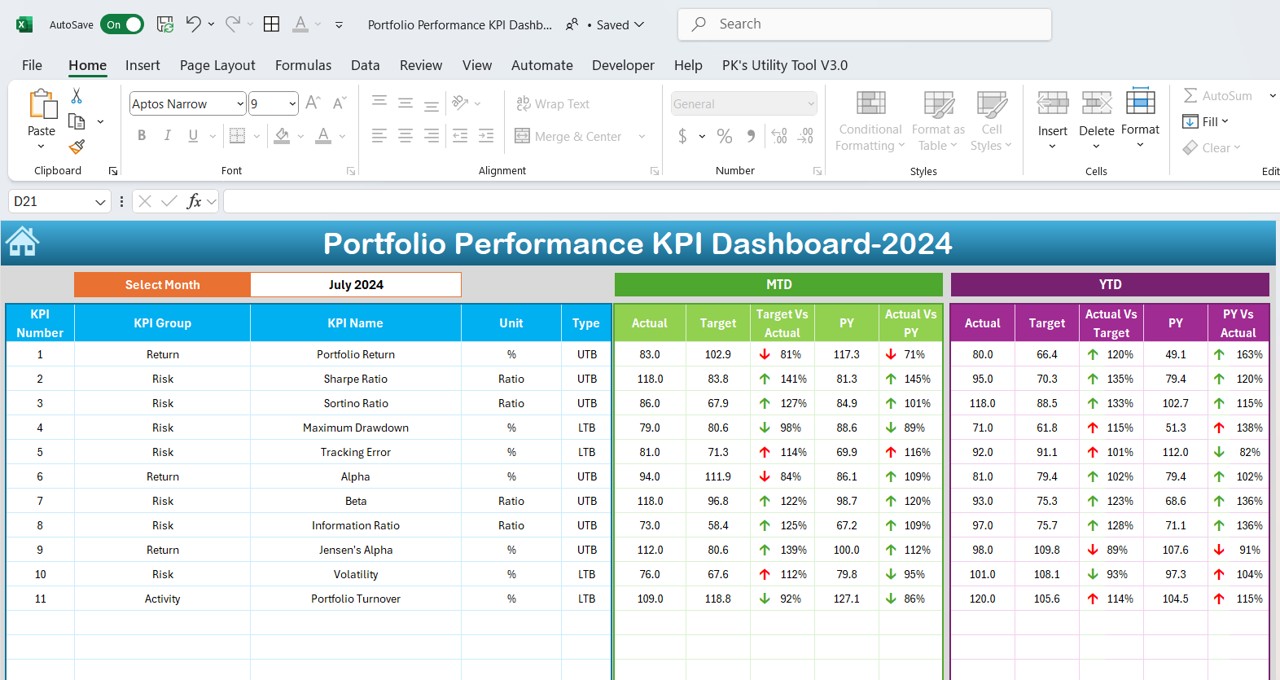
2. Dashboard Sheet: Overview of Key Metrics
The Dashboard Sheet is the heart of the Portfolio Performance KPI Dashboard. This sheet displays an overview of the key KPIs that reflect your portfolio’s health and performance. Key features of the Dashboard Sheet include:
- MTD Actual (Month-to-Date): Displays the actual performance for the current month.
- Target vs Actual (MTD): Compares the actual performance against the set target for the month, with conditional formatting that shows whether the target has been met (up/down arrows).
- Previous Year Data (MTD): Provides a comparison of the current month’s performance with the same period from the previous year.
- YTD Actual (Year-to-Date): Displays the actual performance for the year.
- Target vs Actual (YTD): Shows how the actual YTD performance compares with the target, along with conditional formatting.
- PY vs Actual (YTD): Provides a year-over-year comparison of performance.
This sheet offers an instant snapshot of how the portfolio is performing both relative to expectations and in comparison to historical data.
Click to buy Portfolio Performance KPI Dashboard in Excel
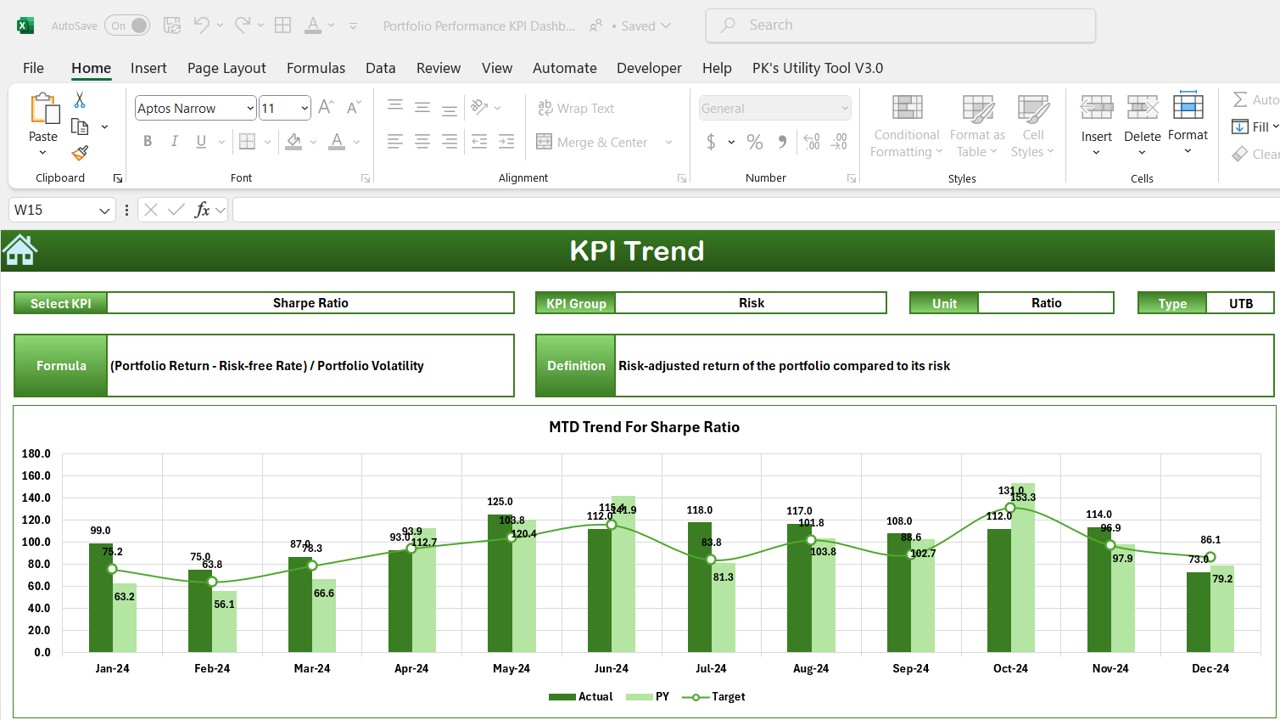
3. KPI Trend Sheet: Analyze Historical Trends
The KPI Trend Sheet allows users to track the performance of selected KPIs over time. This sheet enables users to:
- Select KPI Name: Users can select the KPI they wish to analyze from a dropdown menu.
- KPI Group: Displays the category to which the KPI belongs (e.g., Return, Risk, Allocation).
- Unit of KPI: Shows the unit of measurement for each KPI (e.g., %, Ratio).
- Type of KPI: Indicates whether the KPI is Lower the Better (LTB) or Upper the Better (UTB).
- Formula and Definition: Displays the formula used to calculate the KPI and its definition.
This sheet helps users understand the long-term performance trends of individual KPIs, offering valuable insights into how their portfolio’s performance evolves over time.
Click to buy Portfolio Performance KPI Dashboard in Excel
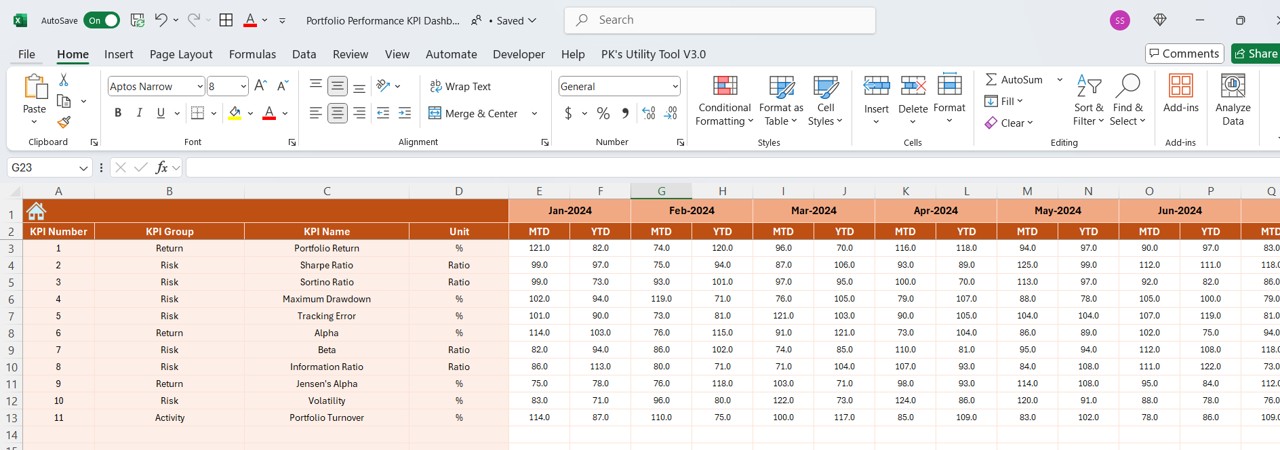
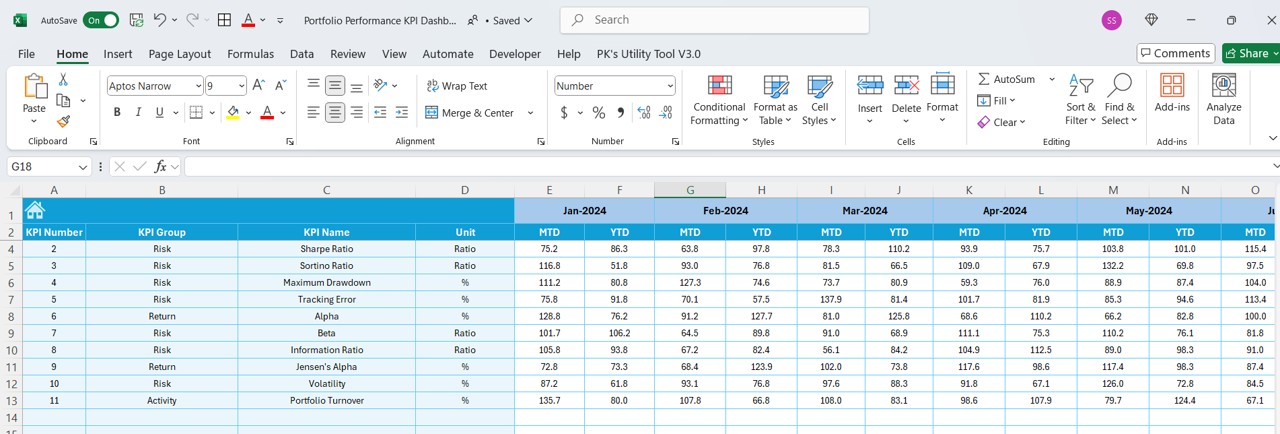
4. Actual Number Sheet: Input Actual Performance Data
In the Actual Number Sheet, users are required to input the actual performance data for the MTD and YTD. This sheet is essential for tracking the portfolio’s real-time performance. Features include:
Month Selection (Range E1): Users can input the first month of the year, and the sheet will update accordingly.
- MTD and YTD Actual: Users can enter the actual values for the selected month and year-to-date.
This sheet helps ensure that the portfolio’s actual performance is tracked consistently, providing accurate and up-to-date data for analysis.
Click to buy Portfolio Performance KPI Dashboard in Excel
5. Target Sheet: Set Performance Targets
The Target Sheet allows users to define their target performance for each KPI, both for the MTD and YTD. By entering target values for each KPI, users can compare their actual performance against their goals. This sheet is important for:
- Setting clear targets for the portfolio’s performance.
- Ensuring that progress toward these targets is tracked effectively.
Click to buy Portfolio Performance KPI Dashboard in Excel
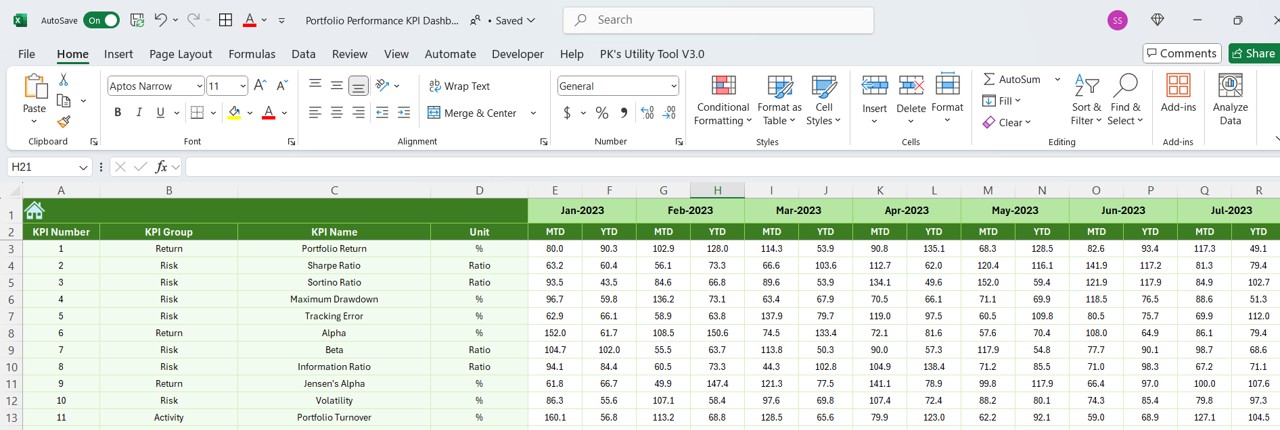
6. Previous Year Number Sheet: Historical Performance Data
The Previous Year Number Sheet enables users to input the performance data from the previous year, offering a historical perspective on portfolio performance. This sheet is critical for:
- Comparing current year performance against the same period from the previous year.
- Understanding year-over-year trends and identifying any improvements or declines in performance.
Click to buy Portfolio Performance KPI Dashboard in Excel
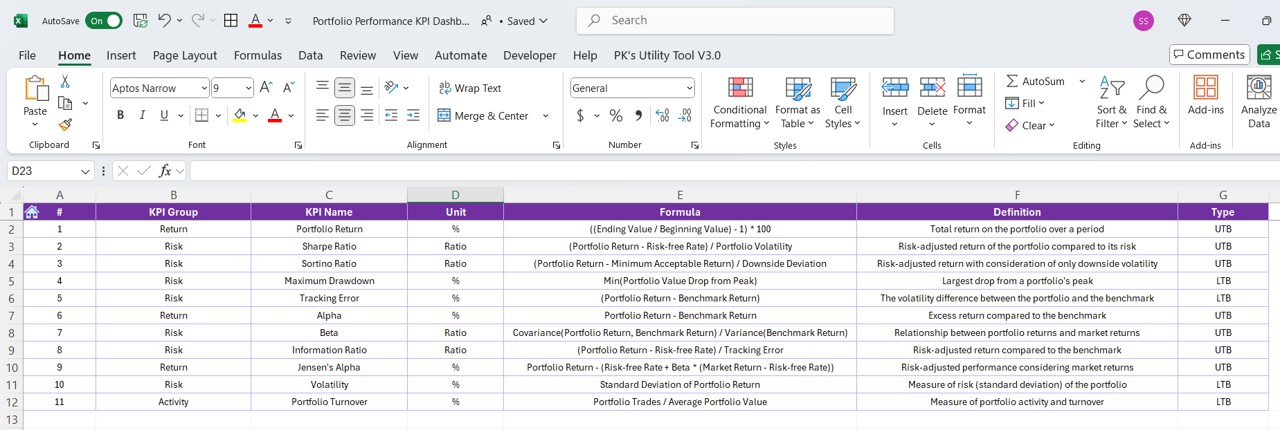
7. KPI Definition Sheet: Clarify Metrics and Formulas
The KPI Definition Sheet provides detailed information about each KPI, including:
- KPI Name
- KPI Group
- Unit of Measurement
- Formula: Explains how each KPI is calculated.
- Definition: A detailed description of each KPI.
This sheet helps users understand the KPIs they are tracking and ensures that all stakeholders have a clear understanding of the metrics.
Click to buy Portfolio Performance KPI Dashboard in Excel
Advantages of Using the Portfolio Performance KPI Dashboard
A Portfolio Performance KPI Dashboard provides numerous advantages for investors looking to track and optimize their investment strategies. Below are some key benefits:
- Comprehensive Data at a Glance: The dashboard consolidates multiple KPIs into one view, providing a comprehensive snapshot of portfolio performance. Users can quickly assess how their investments are performing against targets and benchmarks, making it easier to make informed decisions.
- Easy Comparison of Performance: The dashboard allows for easy comparison of performance across different timeframes (MTD, YTD, Previous Year) and against targets. The use of conditional formatting with arrows makes it visually clear whether the portfolio is on track.
- Historical Trend Analysis: With the KPI Trend Sheet, users can track the historical performance of key metrics. This long-term analysis helps investors understand trends, identify patterns, and make adjustments to their portfolio strategies as needed.
- Improved Decision-Making: Having all the data in one place, along with clear KPIs and historical comparisons, empowers investors to make better, data-driven decisions. It removes guesswork and provides objective insights into portfolio performance.
- Customization and Flexibility: The Portfolio Performance KPI Dashboard is customizable. Users can change the month, select specific KPIs, and input actual numbers and targets, making it flexible to meet the needs of different investors and portfolio types.
Opportunities for Improvement in the Portfolio Performance KPI Dashboard
While the Portfolio Performance KPI Dashboard is a powerful tool, there are always opportunities for improvement. Below are some areas for potential enhancement:
- Integration with External Data Sources: Currently, users need to input data manually. By integrating the dashboard with external data sources such as brokerage accounts, financial APIs, or portfolio management software, data entry can be automated, ensuring real-time updates.
- Predictive Analytics: Incorporating predictive analytics into the dashboard could help investors forecast future portfolio performance based on historical data. Machine learning models could be used to predict risk and returns, helping investors adjust their strategies ahead of time.
- Mobile Accessibility: Offering a mobile version of the dashboard would allow investors to track their portfolio performance on the go. This would increase accessibility and help decision-makers stay updated, regardless of their location.
Best Practices for Using the Portfolio Performance KPI Dashboard
To maximize the effectiveness of the Portfolio Performance KPI Dashboard, here are some best practices to follow:
- Regularly Update Data: It’s important to keep the dashboard updated with the most current data. Set a regular schedule for entering actual performance numbers and updating targets to ensure accurate insights.
- Focus on Relevant KPIs: Track only the KPIs that directly impact your portfolio’s performance. Focus on key metrics like return rates, volatility, and asset allocation. Too many KPIs can lead to analysis paralysis and confusion.
- Use Visuals Effectively; Leverage the dashboard’s visual elements like conditional formatting, charts, and graphs. Visuals help communicate data more effectively, making it easier to spot trends and make decisions quickly.
- Share Insights Across Teams: If you’re working as part of a team or managing investments for multiple clients, share the dashboard regularly with stakeholders. This ensures everyone is aligned and aware of the portfolio’s performance.
Frequently Asked Questions (FAQs)
1. What KPIs should I track in a portfolio performance dashboard?
Key KPIs include:
- Portfolio Return
- Sharpe Ratio
- Maximum Drawdown
- Tracking Error
- Alpha
- Beta
2. Can I customize the dashboard for different portfolios?
Yes, the dashboard is customizable. You can adjust the KPIs, targets, and actual values to suit different portfolio types or investment strategies.
3. How often should I update the data?
The data should be updated regularly, at least monthly, to ensure that the dashboard reflects the most current portfolio performance.
4. Can the dashboard predict future performance?
While the current dashboard tracks historical performance, adding predictive analytics could provide future performance projections.
Conclusion
The Portfolio Performance KPI Dashboard is an essential tool for any investor looking to track and optimize their investment strategies. By providing a clear overview of key metrics and offering the ability to compare actual performance against targets, this dashboard helps investors make better, more informed decisions. Regularly updating the data and following best practices can lead to significant improvements in portfolio management, driving better returns and achieving long-term financial goals.
Visit our YouTube channel to learn step-by-step video tutorials
Click to buy Portfolio Performance KPI Dashboard in Excel


