
In today’s data-driven world, businesses need real-time insights to make strategic decisions. Location-based marketing (LBM) is an essential strategy for businesses looking to optimize their marketing efforts by targeting specific geographic regions. However, managing and analyzing location-based marketing performance can be overwhelming without the right tools.
That’s where the Location-Based Marketing KPI Dashboard in Excel comes into play. This ready-to-use Excel template allows businesses to monitor key performance indicators (KPIs) effectively, ensuring that marketing campaigns are optimized for better engagement, conversions, and ROI.
In this article, we will explore the features, benefits, best practices, and frequently asked questions about the Location-Based Marketing KPI Dashboard in Excel.
Click to Location-Based Marketing KPI
Key Features of the Location-Based Marketing KPI Dashboard
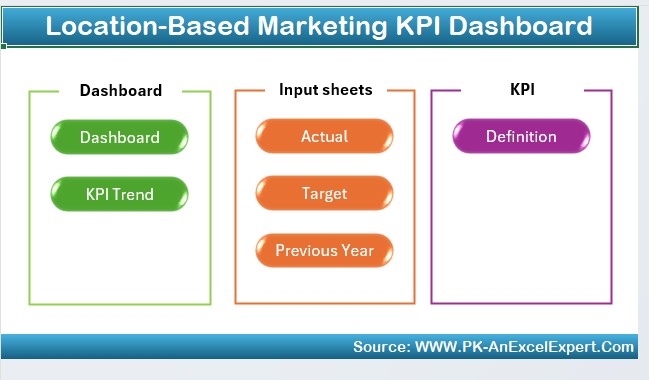
This dashboard consists of 7 worksheets, each designed to help businesses track their location-based marketing KPIs efficiently. Below is an overview of each sheet:
Home Sheet
- Acts as an index sheet for easy navigation.
- Contains six interactive buttons that allow users to jump to different worksheet tabs instantly.
Dashboard Sheet Tab
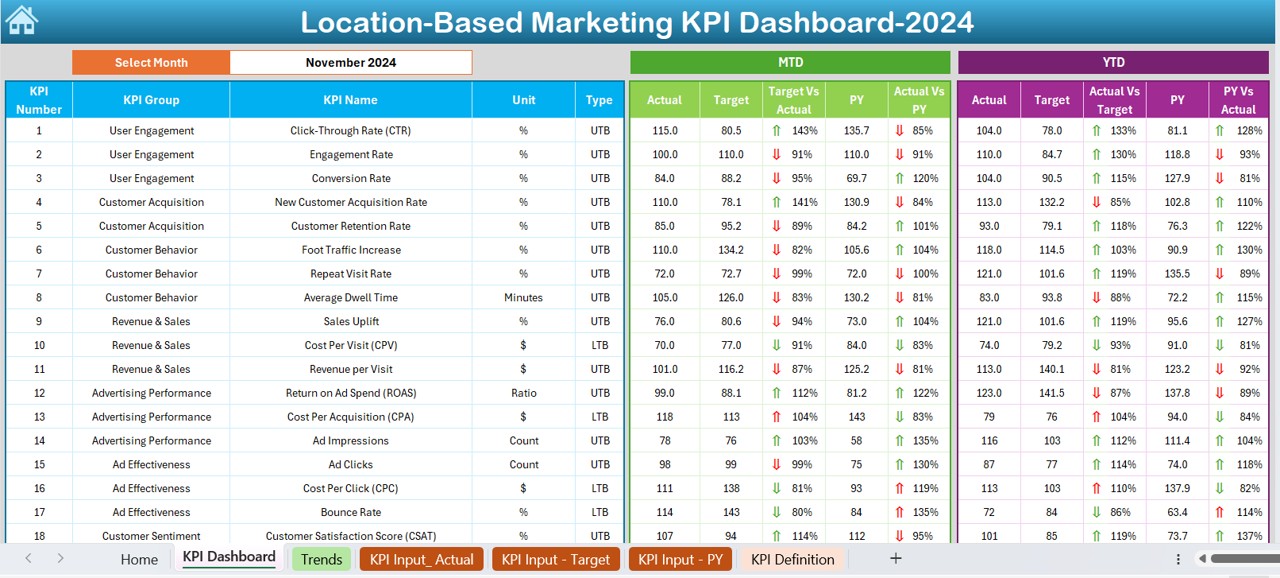
- The main sheet displaying all KPIs and performance metrics.
- A drop-down menu (located in range D3) allows users to select a specific month, dynamically updating all the data on the dashboard.
- Displays Month-To-Date (MTD) and Year-To-Date (YTD) values for Actuals, Targets, and Previous Year data.
- Features conditional formatting with up/down arrows to highlight performance changes.
KPI Trend Sheet Tab
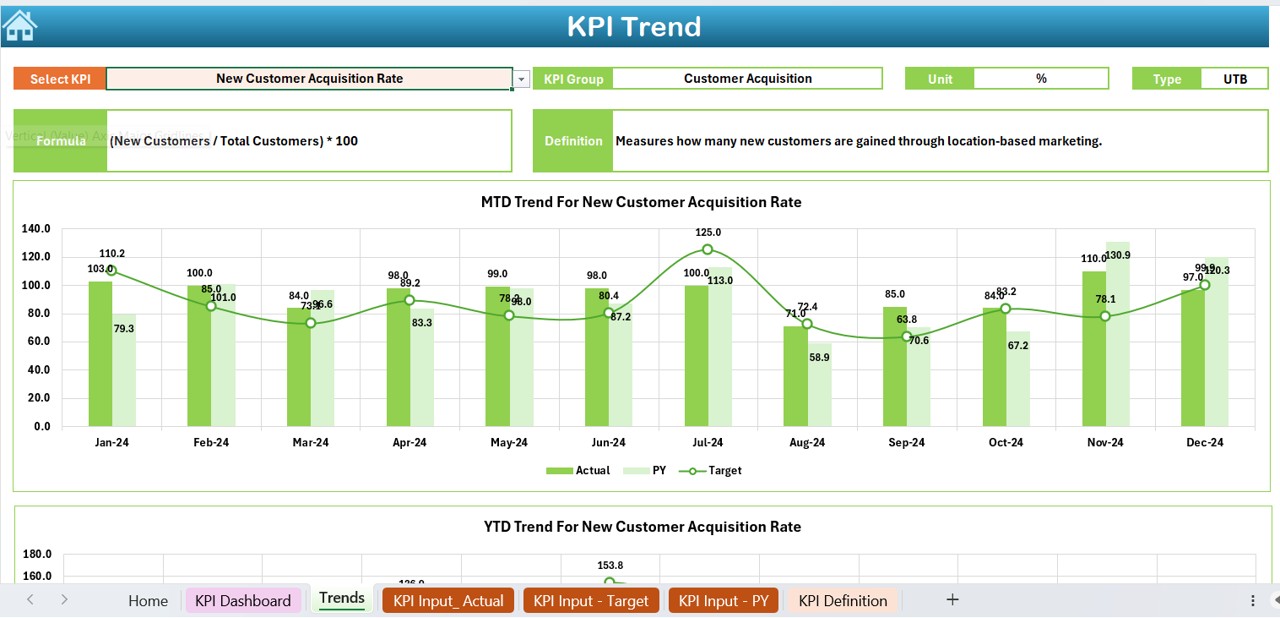
- Allows users to select a specific KPI from a drop-down menu (located in C3).
- Provides details such as KPI Group, KPI Unit, KPI Type (Lower is Better or Higher is Better), KPI Formula, and KPI Definition.
- Displays MTD and YTD trend charts for Actual, Target, and Previous Year (PY) numbers.
Click to Location-Based Marketing KPI
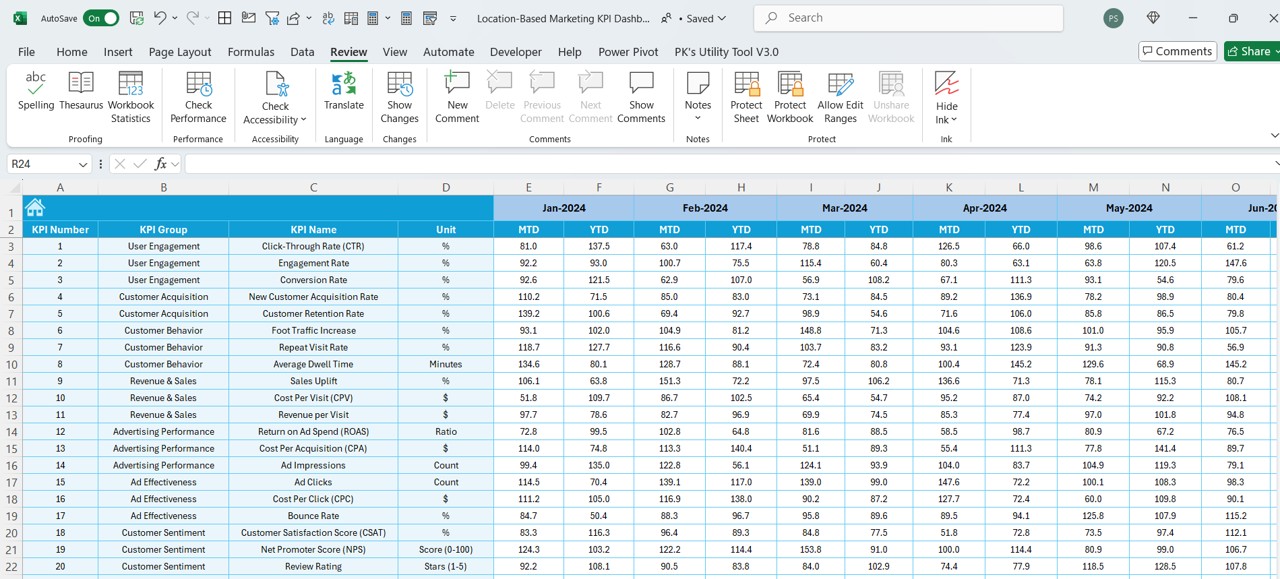
Actual Numbers Input Sheet
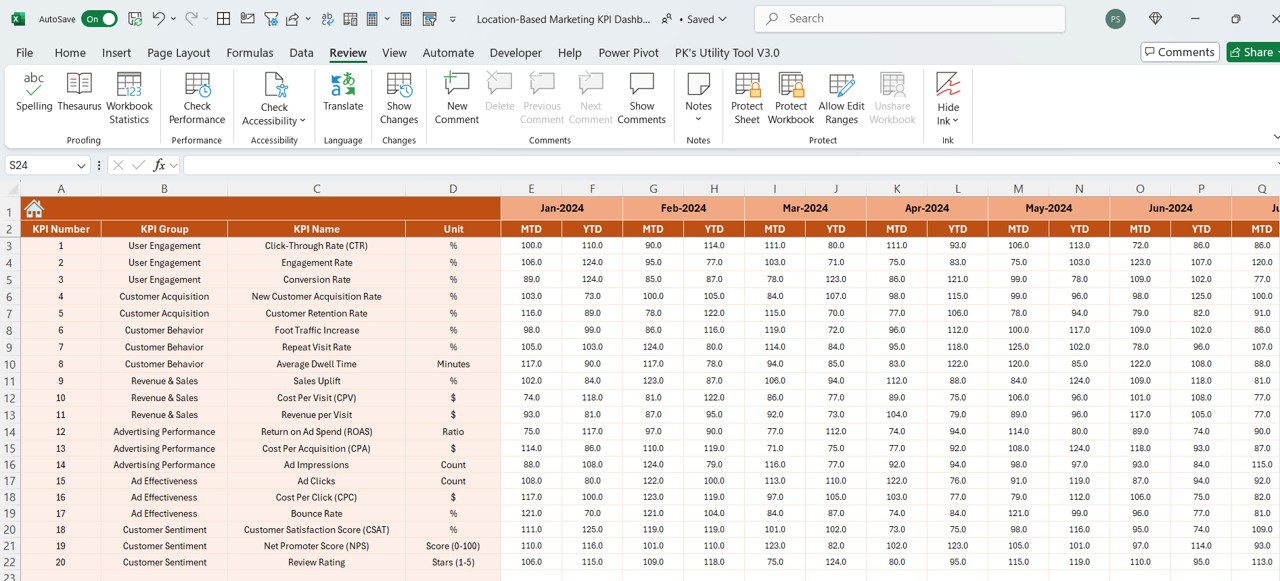
- Users enter actual numbers for both MTD and YTD.
- The first month of the year must be entered in E1 to ensure accurate calculations.
Target Sheet Tab
- Businesses enter the target numbers for each KPI by month.
- Data input is required for both MTD and YTD values.
Previous Year Number Sheet Tab
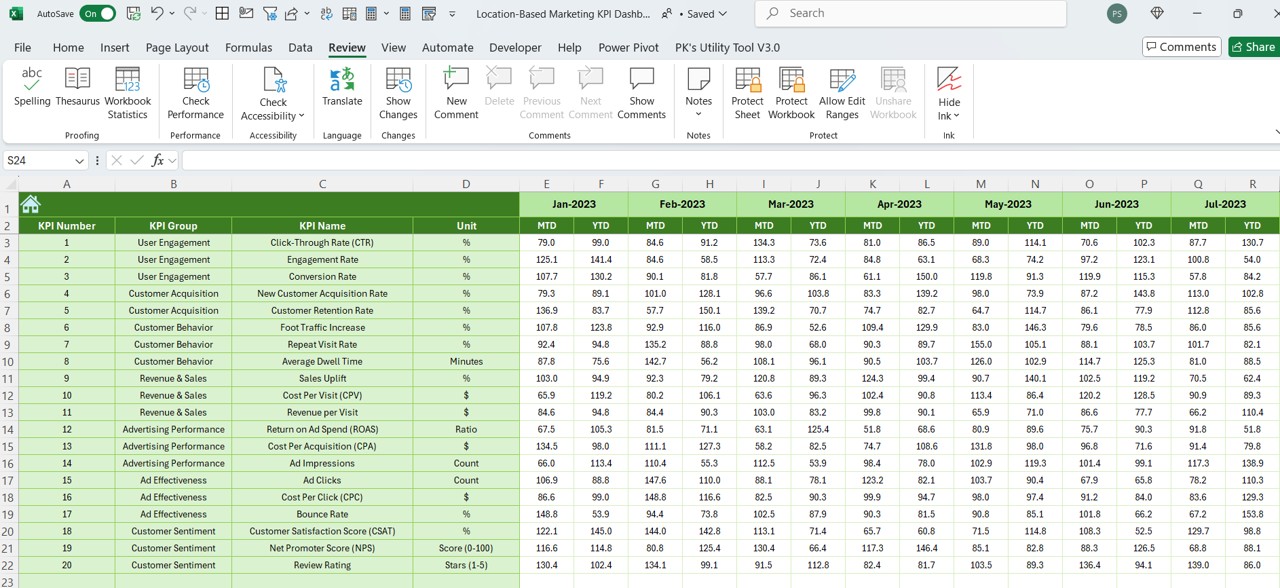
- Users input previous year’s data for accurate comparisons.
- Ensures that trends and progress are measured correctly.
KPI Definition Sheet Tab
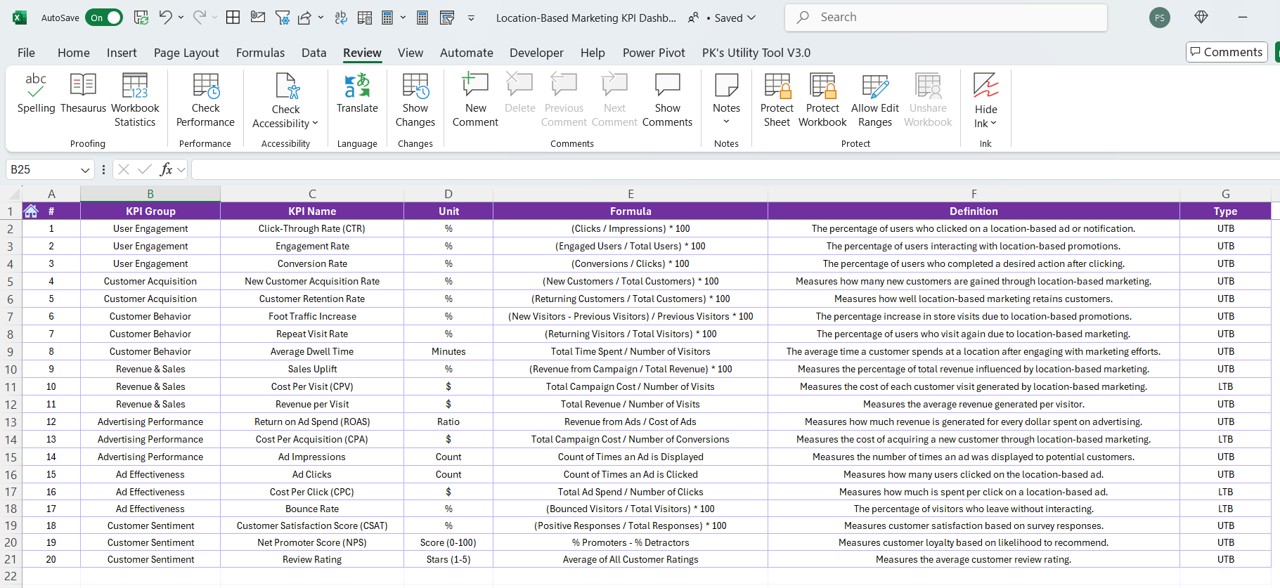
- Users define each KPI by providing details such as:
- KPI Name
- KPI Group
- Measurement Unit
- Formula
- Definition
Advantages of the Location-Based Marketing KPI Dashboard
Click to Location-Based Marketing KPI
✅ Improves Decision-Making: The dashboard provides real-time insights into location-based marketing performance, allowing businesses to make informed decisions quickly.
📊 Enhanced Data Visualization: With trend charts and conditional formatting, users can identify patterns and take proactive steps to optimize campaigns.
⏳ Saves Time & Effort: The structured dashboard eliminates the need for manual data analysis, enabling teams to focus on strategy and execution.
🎯 Tracks Performance with Precision: With accurate MTD, YTD, and PY comparisons, businesses can monitor their progress toward marketing goals effectively.
💰 Boosts ROI: By tracking KPIs effectively, companies can allocate resources wisely, ensuring that marketing efforts drive maximum revenue.
Best Practices for Using the Location-Based Marketing KPI Dashboard
- Regular Data Updates: Ensure actual numbers, targets, and previous year data are updated consistently to maintain accuracy.
- Use Conditional Formatting Insights: Pay close attention to up/down arrows and color-coded trends to spot opportunities and areas for improvement.
- Leverage KPI Trend Analysis: Use the KPI Trend Sheet to analyze long-term performance and make data-backed adjustments.
- Ensure Data Accuracy: Always validate inputs to ensure numbers reflect real-world performance accurately.
- Utilize Monthly Filters: Use the drop-down menu on the Dashboard Sheet to focus on specific months and assess targeted performance.
Conclusion
The Location-Based Marketing KPI Dashboard in Excel is an indispensable tool for businesses looking to optimize their marketing efforts. By offering real-time performance tracking, enhanced data visualization, and actionable insights, this dashboard helps businesses improve decision-making, increase efficiency, and boost ROI. With the right approach and regular updates, companies can maximize their marketing impact and stay ahead of the competition.
Frequently Asked Questions (FAQs)
What is a Location-Based Marketing KPI Dashboard?
A Location-Based Marketing KPI Dashboard is a performance tracking tool designed to monitor key metrics for marketing campaigns targeted at specific geographic locations. It provides insights into MTD, YTD, and previous year performance to help businesses optimize their marketing strategies.
Who can use this dashboard?
- This dashboard is ideal for:
- Marketing teams looking to analyze location-based campaigns.
- Business owners who want to track regional performance.
- Data analysts responsible for reporting marketing KPIs.
Can I customize the KPI Dashboard?
Yes! The Excel template allows for full customization. Users can add, modify, or remove KPIs based on their business needs.
How often should I update the data?
For accurate tracking and reporting, it is recommended to update the data monthly or as frequently as needed based on marketing campaign cycles.
Do I need advanced Excel skills to use this dashboard?
No! This dashboard is user-friendly and designed for ease of use. However, a basic understanding of Excel functions and drop-down menus can enhance the experience.
Is this dashboard suitable for small businesses?
Absolutely! Whether you run a small business or a large enterprise, this KPI dashboard can help optimize marketing strategies and drive better results.
Click to Location-Based Marketing KPI
Visit our YouTube channel to learn step-by-step video tutorials


