The financial world thrives on data, and for banking operations, the key to success is not just analyzing raw figures but tracking them with precision. One of the best ways to monitor performance in the banking sector is by using a Banking Operations KPI Dashboard. This dashboard provides a clear, organized view of key performance indicators (KPIs) to help decision-makers monitor and improve operational efficiency.
In this article, we will discuss everything you need to know about Banking Operations KPI Dashboards, including what they are, how they work, and the key metrics you should track. Additionally, we will explore the advantages, best practices, and opportunities for improvement in using KPIs for banking operations.
What is a Banking Operations KPI Dashboard?
A Banking Operations KPI Dashboard is a data visualization tool used by banks to track key performance indicators (KPIs) related to their operational processes. It helps monitor a variety of performance metrics, from customer satisfaction and profitability to risk management and efficiency.
Why Use a Banking Operations KPI Dashboard?
A well-structured KPI dashboard offers several benefits for banks:
- Efficiency: It provides a consolidated view of performance metrics, saving time in finding insights.
- Clarity: The dashboard uses visual elements such as graphs and charts, making complex data easier to understand.
- Real-time Monitoring: Allows managers to track performance and adjust strategies in real-time.
By tracking performance across various areas, such as credit risk, profitability, and liquidity, the dashboard provides a powerful tool to drive better decision-making.
Key Features of the Banking Operations KPI Dashboard Template
Our Banking Operations KPI Dashboard template is ready to use and offers the following essential features:
Home Sheet: The Home Sheet serves as the index page, featuring six buttons to jump directly to the respective sheets within the dashboard. It provides a clear navigation structure to access the data you need.
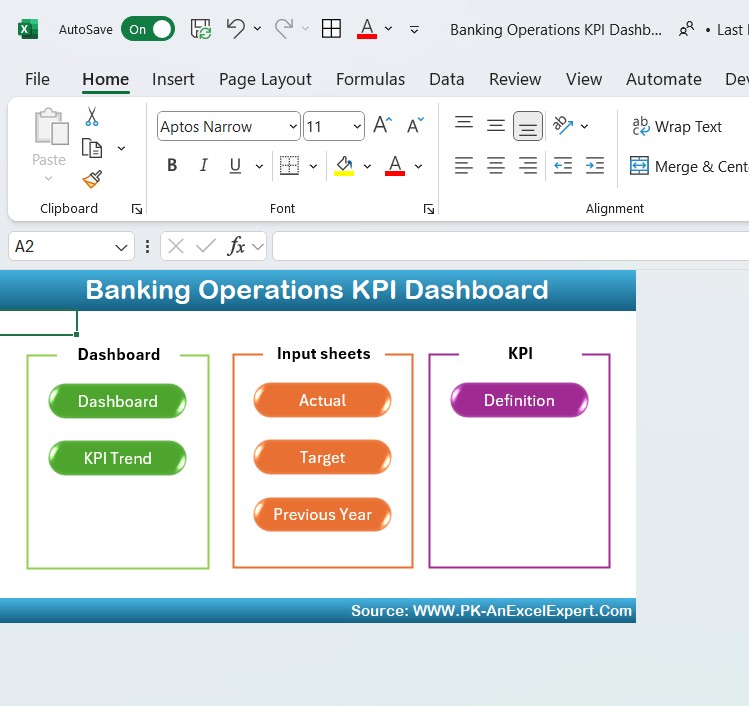
Click to buy Banking Operations KPI Dashboard in Excel
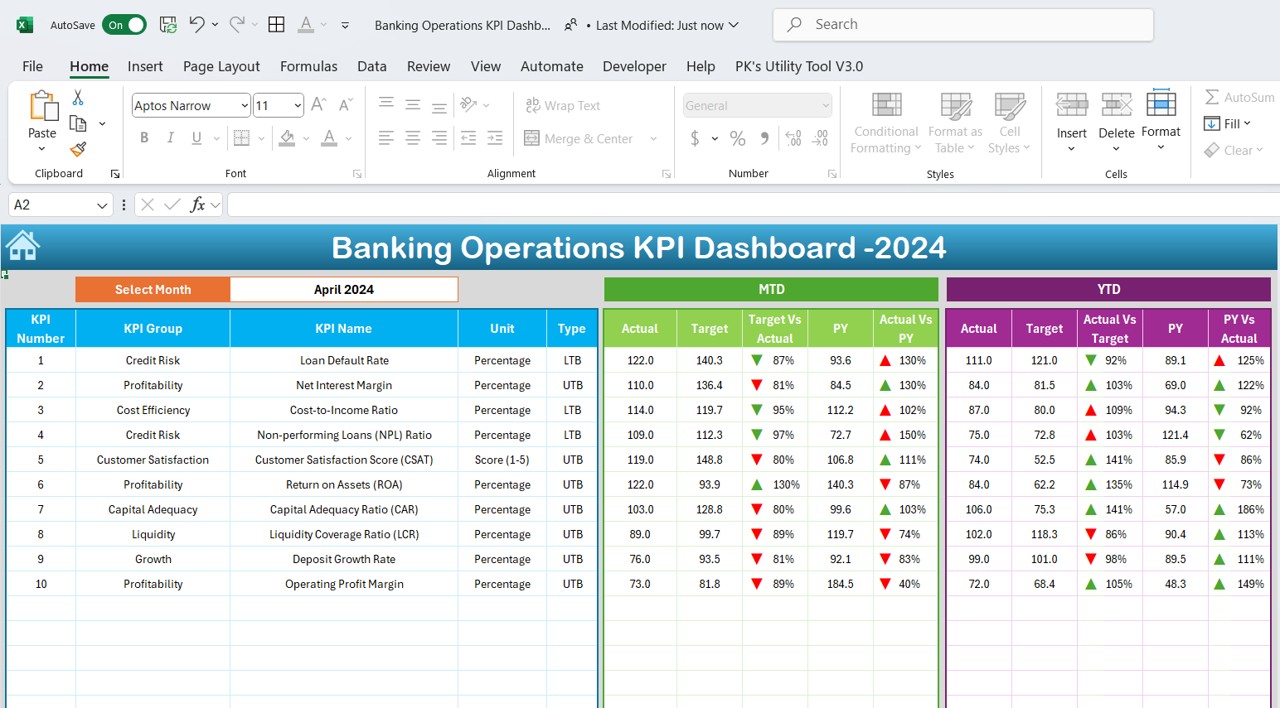
Dashboard Sheet Tab: This is the central hub of the dashboard. Here, you can view all KPIs, with sections for:
- MTD (Month-to-Date) Actual, Target, and Previous Year data.
- YTD (Year-to-Date) Actual, Target, and Previous Year data.
- Target vs Actual comparison, including conditional formatting with up/down arrows.
By selecting the desired month from the drop-down menu, the dashboard dynamically updates to reflect the selected month’s data.
Click to buy Banking Operations KPI Dashboard in Excel
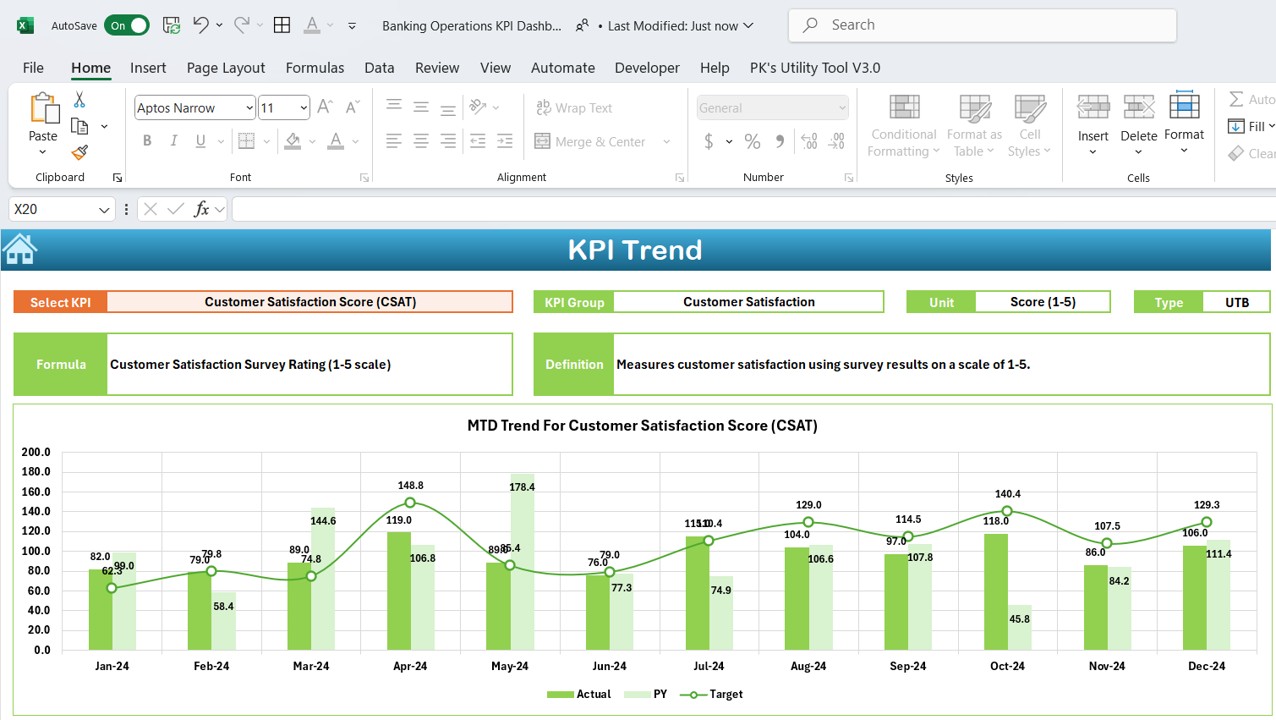
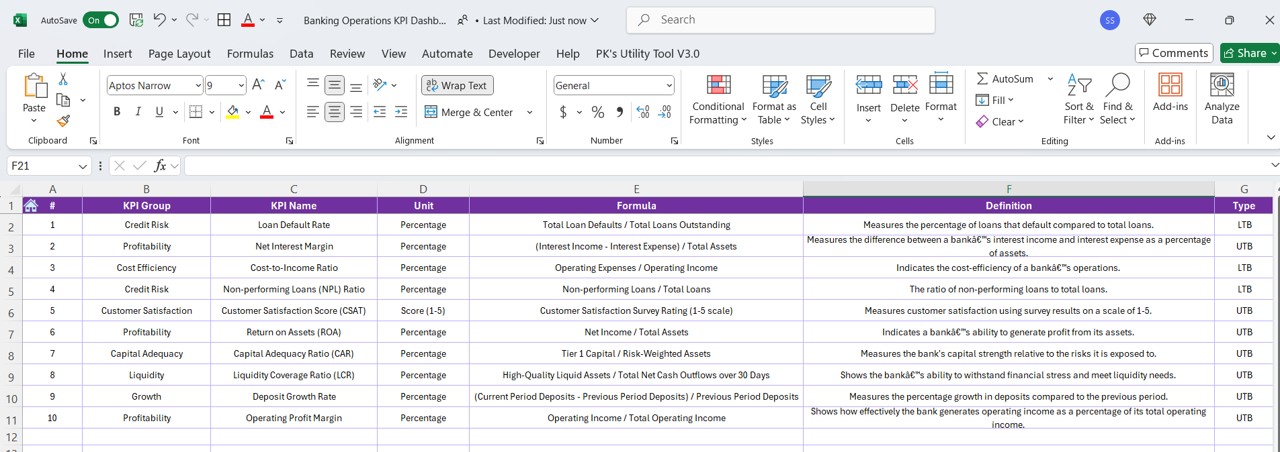
KPI Trend Sheet Tab: The KPI Trend Sheet allows you to choose the KPI name from a dropdown list. It displays:
- KPI Group
- Unit of KPI
- Type of KPI (Whether lower or upper is better)
- Formula of the KPI
- KPI Definition
This sheet helps in analyzing trends for each KPI, making it easier to identify areas for improvement.
Click to buy Banking Operations KPI Dashboard in Excel
Actual Number Sheet Tab: In this sheet, you can enter actual numbers for YTD and MTD for a specific month. Simply change the month in the provided field to update the actual performance figures.
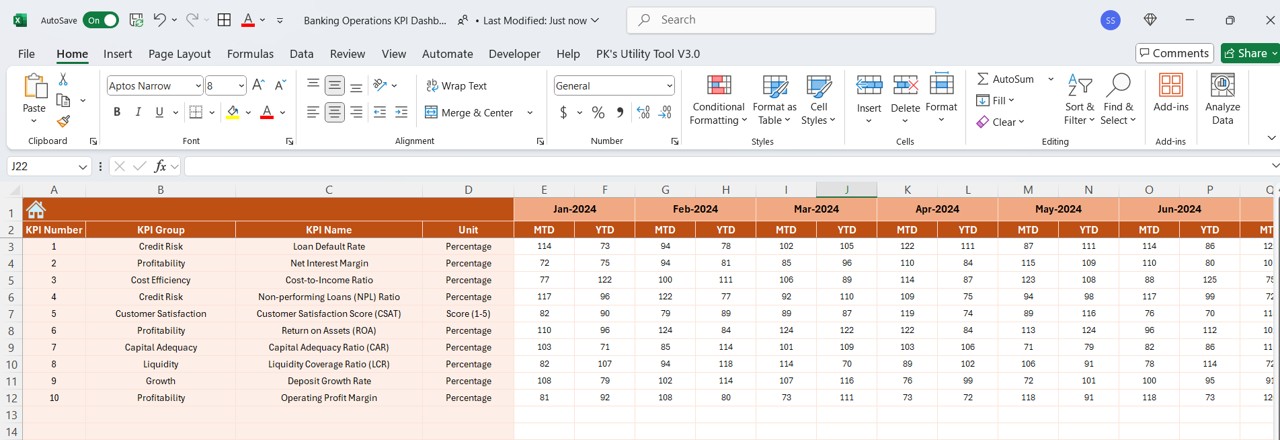
Click to buy Banking Operations KPI Dashboard in Excel
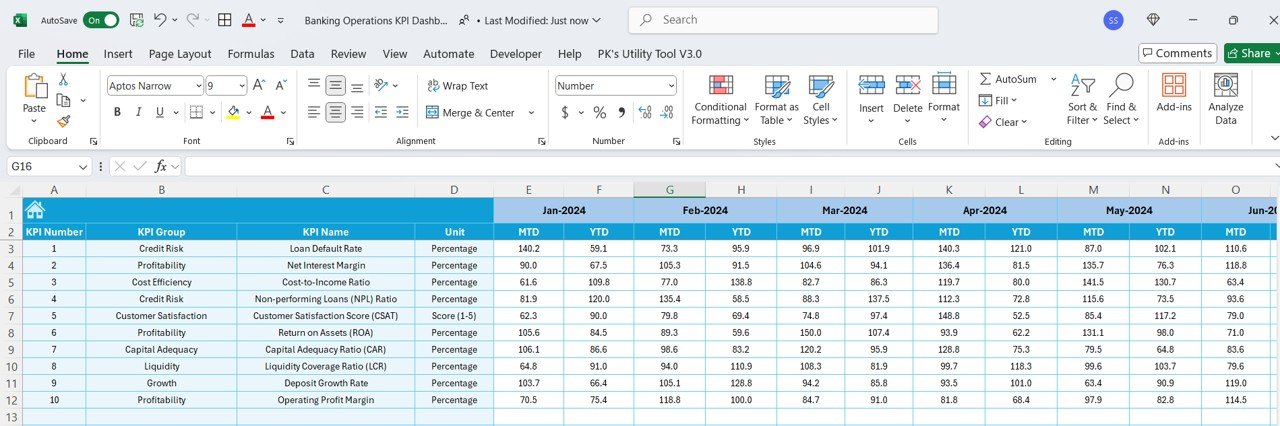
Target Sheet Tab: The Target Sheet enables users to input target values for each KPI, both for MTD and YTD, ensuring that performance goals are tracked accurately.
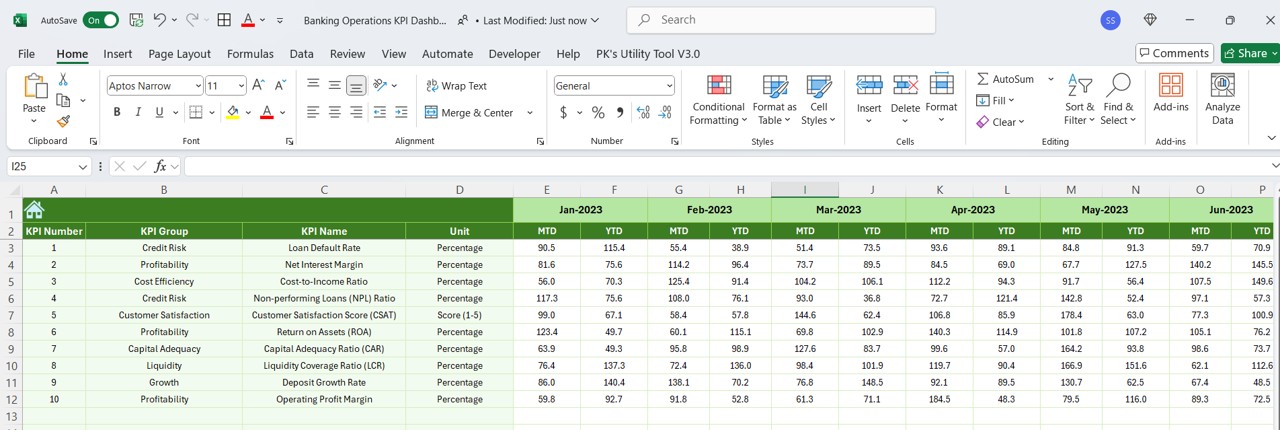
Previous Year Number Sheet Tab: In this sheet, you enter the previous year’s figures for comparison with current year data, providing valuable context for performance analysis.
Click to buy Banking Operations KPI Dashboard in Excel
Click to buy Banking Operations KPI Dashboard in Excel
KPI Definition Sheet Tab: This sheet allows you to input the KPI name, group, unit, formula, and a detailed definition for each KPI. It helps in standardizing the metrics used throughout the dashboard.
Click to buy Banking Operations KPI Dashboard in Excel
Advantages of Using a Banking Operations KPI Dashboard
A Banking Operations KPI Dashboard brings numerous benefits to banks and financial institutions. Here are some of the key advantages:
- Improved Decision-Making: By having a clear and concise view of all essential metrics, decision-makers can make more informed and timely choices. This helps in adapting strategies quickly and ensuring the bank stays on course toward its goals.
- Better Risk Management: The dashboard allows you to monitor critical risk metrics, such as loan default rates, non-performing loans, and capital adequacy. By tracking these KPIs, you can manage risk more effectively and take corrective actions before issues escalate.
- Real-Time Monitoring: The dynamic features of the dashboard allow for real-time updates, meaning you can track performance as it happens. This is especially important in fast-paced banking operations where timing is critical.
- Streamlined Reporting: Instead of manually collecting data from multiple sources, the dashboard consolidates everything into a single platform. This reduces the time spent on reporting, allowing employees to focus on more critical tasks.
- Enhanced Transparency: A KPI dashboard provides a transparent view of bank performance for stakeholders at all levels. By clearly showing performance metrics, the dashboard fosters accountability and trust.
Opportunities for Improvement in Banking Operations KPI Dashboard
While KPI dashboards are powerful tools, there is always room for improvement. Here are a few opportunities to enhance the effectiveness of your banking operations KPI dashboard:
- Customization: Though the template comes with predefined sheets, banks should consider customizing the dashboard to reflect their unique objectives and KPIs. This could include adding industry-specific metrics or performance indicators relevant to the bank’s operations.
- Data Integration: To improve the dashboard’s usefulness, integrating data from various bank systems (CRM, loan management, etc.) can provide a more comprehensive view of performance. Automated data pulls from these systems would ensure accuracy and reduce manual entry errors.
- Mobile Compatibility: As decision-makers are often on the go, optimizing the dashboard for mobile devices would make it even more accessible. Banks should consider creating a mobile-responsive version of the dashboard to ensure seamless access anytime, anywhere.
- Predictive Analytics: Integrating predictive analytics into the dashboard could provide insights into future trends based on historical data. This would enable more proactive decision-making, especially in areas like credit risk and liquidity management.
Best Practices for Using a Banking Operations KPI Dashboard
Here are some best practices to make the most of your Banking Operations KPI Dashboard:
- Regular Data Updates: Ensure that the data entered into the dashboard is updated regularly to reflect the latest figures. This includes both actual numbers and targets, as outdated information can lead to poor decision-making.
- Set Realistic Targets: Targets should be set based on historical performance and industry benchmarks. Setting overly ambitious targets can lead to frustration, while overly conservative targets may result in missed opportunities for growth.
- Focus on Key Metrics: Not all KPIs are created equal. Focus on the most critical KPIs that directly affect the bank’s performance and growth. Regularly review and adjust your KPIs as needed to stay aligned with the bank’s goals.
- Involve Stakeholders: Encourage collaboration by involving various stakeholders in the KPI dashboard process. This will ensure that all relevant departments have input into the metrics being tracked and will promote engagement with the dashboard.
- Leverage Conditional Formatting: Using conditional formatting for Target vs Actual comparisons (e.g., color-coded arrows) can make it easier to spot areas that require attention. This visual cue helps quickly identify performance gaps.
Frequently Asked Questions (FAQs)
1. What are KPIs in Banking Operations?
Key Performance Indicators (KPIs) in banking operations are metrics used to evaluate the success of various banking activities, such as profitability, liquidity, and risk management.
2. How Do I Set KPIs for My Banking Operations?
Setting KPIs involves identifying the most important metrics that reflect the bank’s performance, aligning them with business objectives, and ensuring that they are measurable and relevant.
3. How Often Should I Update the Banking Operations KPI Dashboard?
It is crucial to update the dashboard at least once a month to reflect the latest performance data. However, more frequent updates may be required for certain high-priority metrics.
4. Can I Customize the Banking Operations KPI Dashboard Template?
Yes, the template is customizable to fit your bank’s specific needs. You can add or remove KPIs and adjust the layout to meet your requirements.
5. How Can I Ensure Data Accuracy in My Banking Operations KPI Dashboard?
Ensure data accuracy by integrating your dashboard with your bank’s existing systems for real-time data entry. Regular audits and validation checks can also help maintain the integrity of the data.
Conclusion
A Banking Operations KPI Dashboard is an invaluable tool for any bank or financial institution aiming to improve performance, manage risk, and increase profitability. By tracking essential KPIs, banks can make informed decisions, streamline operations, and foster growth. Whether you are using a pre-built template or customizing it to suit your needs, this tool helps banks stay competitive in a fast-changing industry.
Visit our YouTube channel to learn step-by-step video tutorials
Click to buy Banking Operations KPI Dashboard in Excel