In today’s data-driven world, tracking community engagement is crucial for organizations, nonprofits, and social enterprises. A Community Engagement KPI Dashboard in Excel provides a structured way to monitor key performance indicators (KPIs) related to outreach, participation, and impact. This dashboard allows users to track, analyze, and visualize engagement metrics in real-time, ensuring informed decision-making and improved strategies.
In this article, we will explore the key features, benefits, and best practices for using a Community Engagement KPI Dashboard in Excel effectively. Additionally, we will answer common questions to help you maximize the utility of this dashboard.
Click to Community Engagement KPI
Why Use a Community Engagement KPI Dashboard?
A well-structured KPI dashboard provides real-time insights into community engagement, making it easier to:
- Track participation and engagement trends
- Compare actual performance against targets
- Identify strengths and areas for improvement
- Make data-driven decisions for better outreach
Without a structured dashboard, organizations may struggle to collect, organize, and interpret engagement data efficiently. Excel dashboards provide an accessible and cost-effective solution for monitoring and improving engagement metrics.
Key Features of the Community Engagement KPI Dashboard in Excel
This ready-to-use Community Engagement KPI Dashboard is designed to simplify KPI tracking and analysis. Below are the seven core worksheets included in this template:
Home Sheet
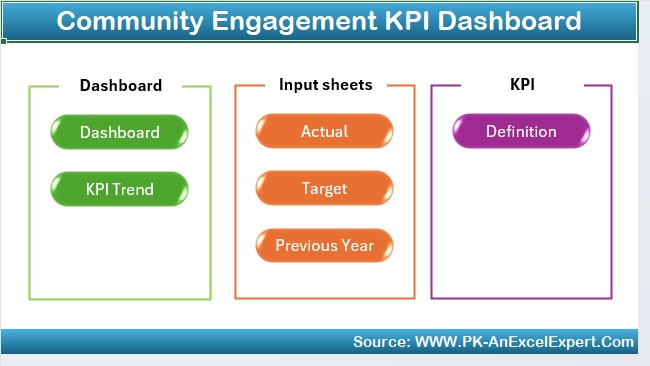
The Home Sheet acts as an index page, allowing users to navigate through the dashboard seamlessly. It features six quick-access buttons, directing users to different worksheet tabs. This ensures an intuitive user experience and efficient workflow.
Click to Community Engagement KPI
Dashboard Sheet Tab
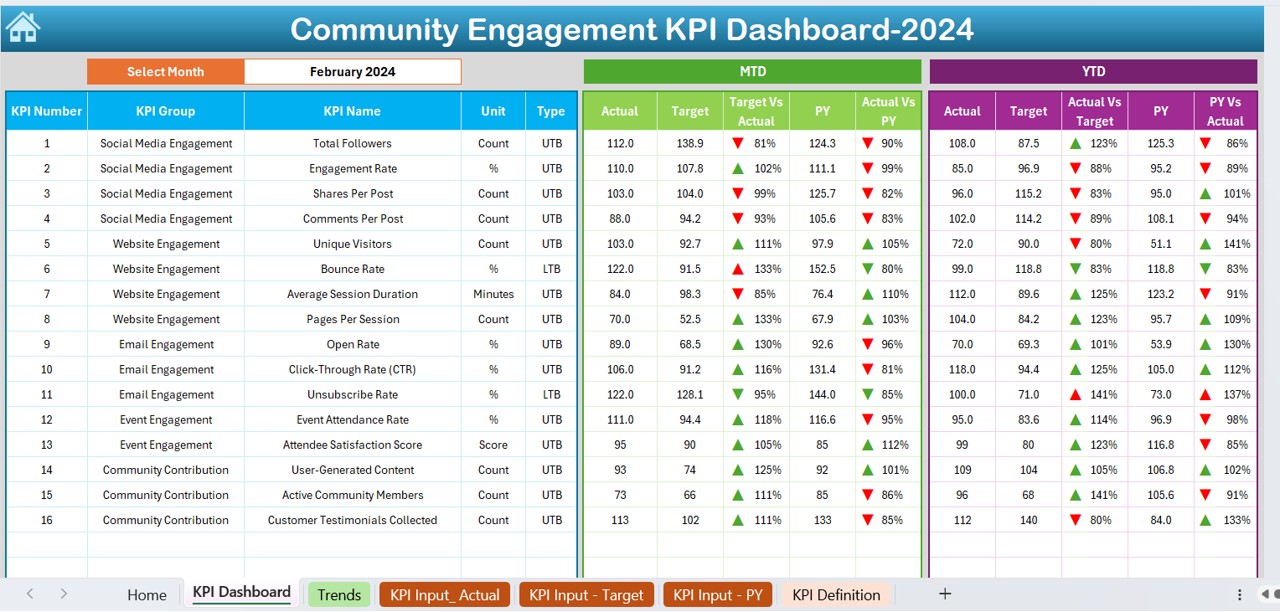
The Dashboard Sheet is the main analytics hub, displaying all KPI-related data. Here’s what it includes:
- Month Selection (Drop-down on D3): Users can choose a specific month, and all dashboard values will update accordingly.
- MTD and YTD Analysis: The sheet presents both Month-To-Date (MTD) and Year-To-Date (YTD) actual figures.
- Target vs. Actual Comparison: It compares current performance against set targets, using conditional formatting with up/down arrows to indicate trends.
- Previous Year Data Analysis: Users can compare the current year’s performance against the same period last year.
KPI Trend Sheet Tab
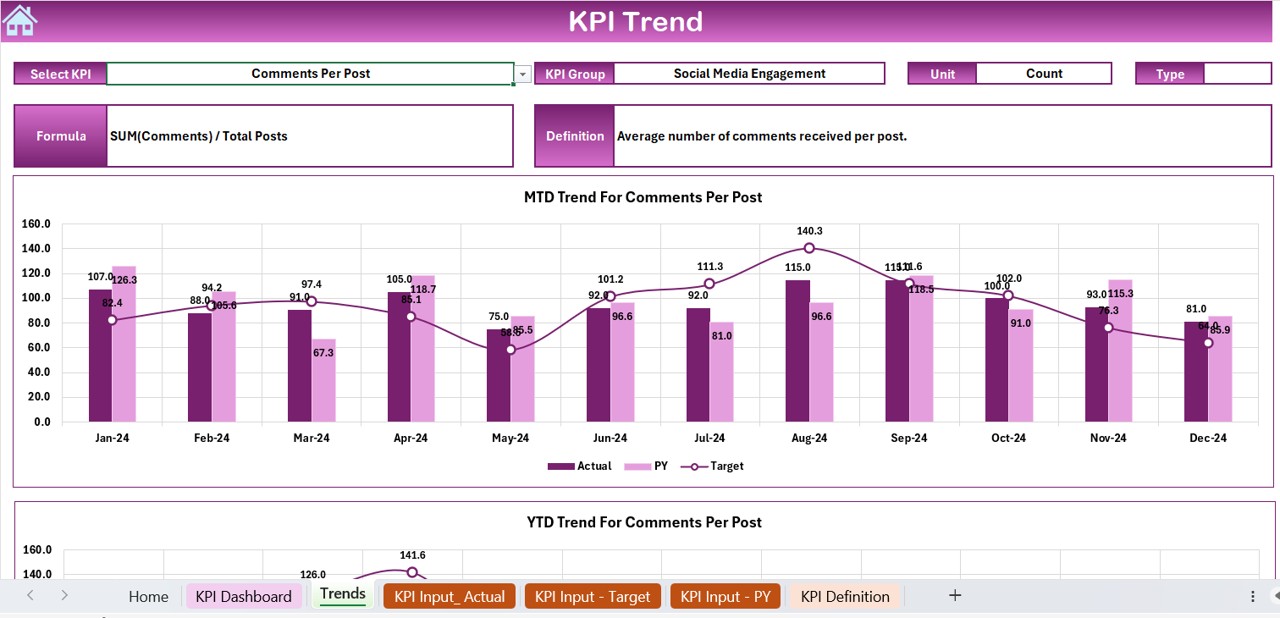
This sheet helps users track KPI trends over time and understand performance fluctuations.
Click to Community Engagement KPI
- Users can select a KPI from a drop-down menu in cell C3.
- The sheet displays essential details such as:
- KPI Group (e.g., Social Media, Events, Volunteer Participation)
- Measurement Unit (e.g., Percentage, Count, Engagement Rate)
- Performance Type (Lower is better / Higher is better)
- KPI Formula and Definition
The sheet also features visual trend charts for MTD and YTD performance comparisons.
Actual Numbers Input Sheet
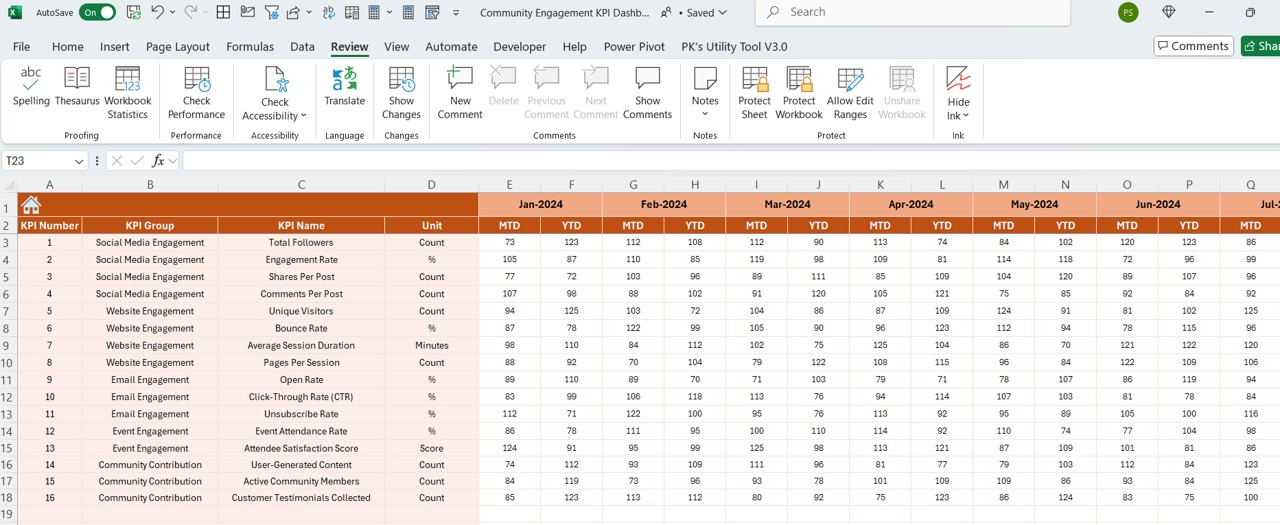
- This sheet is used to enter actual engagement data for each KPI.
- Users can update numbers for each month by entering the first month of the year in cell E1.
Target Sheet Tab
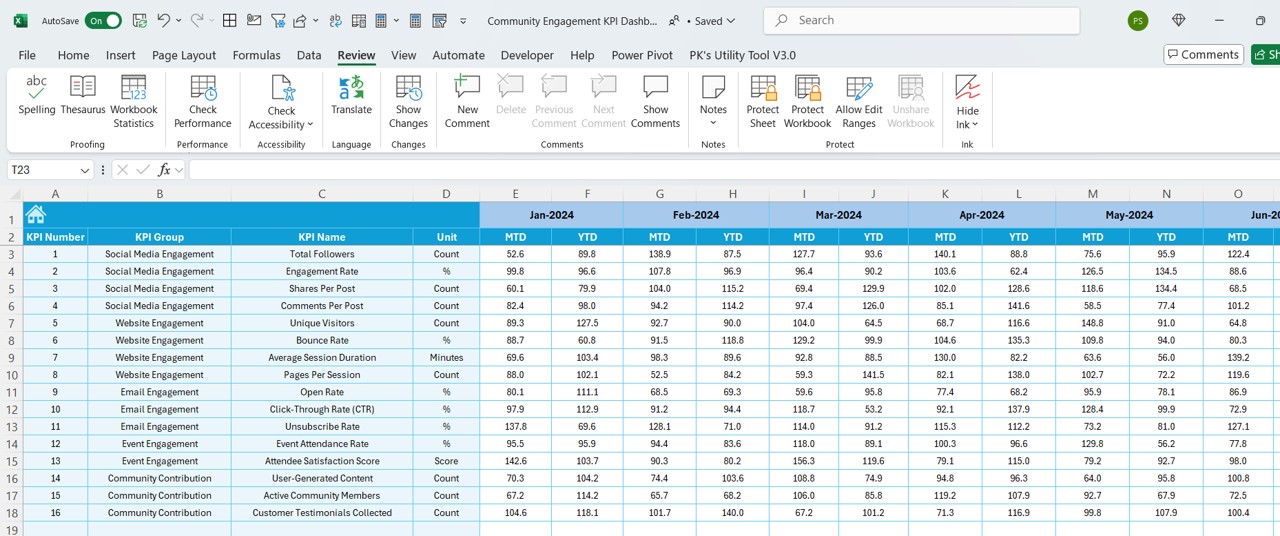
- Here, users can input the target values for each KPI on a monthly and yearly basis.
- This allows for goal tracking and performance evaluation.
Click to Community Engagement KPI
Previous Year Numbers Sheet Tab
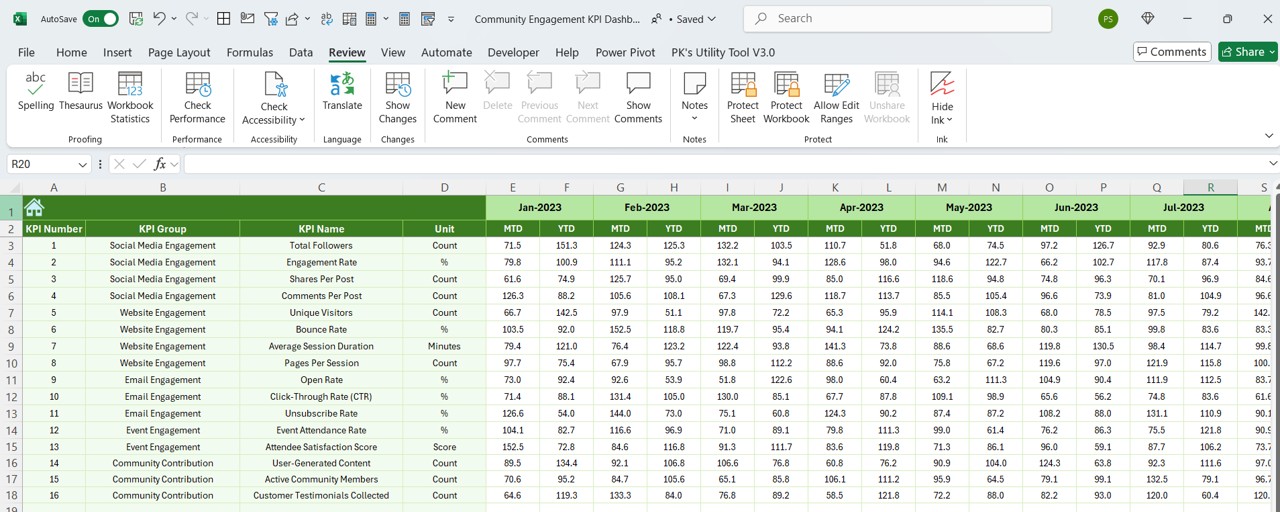
- Users can enter last year’s engagement metrics for direct comparison.
- This helps in evaluating growth, decline, or stagnation in engagement efforts.
KPI Definition Sheet Tab
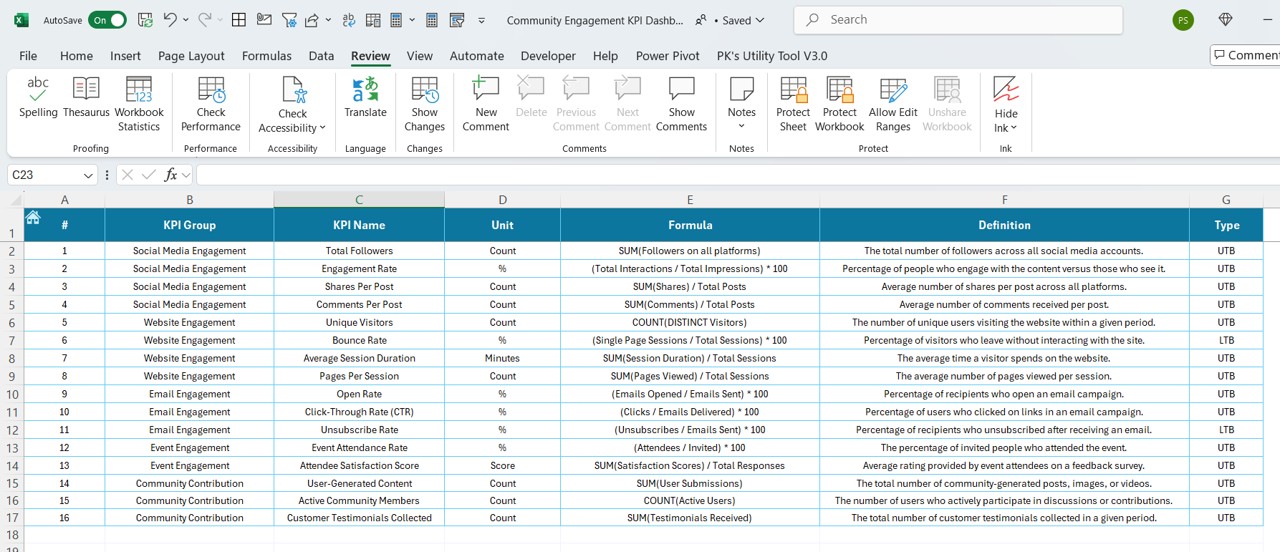
This sheet stores the detailed definitions of each KPI, including:
- KPI Name
- Category/Group
- Measurement Unit
- Formula
- KPI Explanation
- Keeping this information organized ensures consistency in data tracking.
Advantages of Using a Community Engagement KPI Dashboard
📊 Data-Driven Decision Making: This dashboard allows organizations to make informed decisions based on actual engagement metrics rather than assumptions.
📈 Real-Time Performance Tracking: Users can monitor community engagement in real time, ensuring quick responses to any changes or trends.
📅 Improved Planning & Strategy: With month-to-month tracking, organizations can identify patterns and optimize outreach efforts accordingly.
🎯 Enhanced Accountability: By comparing actual performance with set targets, teams stay accountable and focused on achieving goals.
🔍 Customizable & Scalable: Since it’s built in Excel, the dashboard is fully customizable, allowing users to modify KPIs based on specific needs.
Best Practices for Using the Community Engagement KPI Dashboard
✅ Define Clear KPIs
- Choose engagement metrics that align with organizational goals.
- Ensure each KPI has a clear definition and measurement unit.
📌 Regularly Update Data
- Enter actual figures monthly to keep the dashboard up to date.
- Compare against targets and previous year values.
📊 Use Data Visualization Effectively
- Leverage charts, graphs, and conditional formatting for better readability.
- Utilize trend lines to identify long-term engagement patterns.
📥 Ensure Data Accuracy
- Cross-check numbers before entering them into the dashboard.
- Validate KPI formulas to avoid calculation errors.
🔄 Review & Adjust KPIs as Needed
- Community engagement metrics should evolve over time.
- Adjust KPIs based on new goals, trends, and community feedback.
Conclusion
A Community Engagement KPI Dashboard in Excel is an invaluable tool for organizations looking to track, measure, and enhance their engagement efforts. This structured template simplifies data management, improves decision-making, and ensures that outreach initiatives are effective.
Frequently Asked Questions (FAQs)
What is a Community Engagement KPI Dashboard?
A Community Engagement KPI Dashboard is a structured Excel-based tool used to track key engagement metrics, such as participation rates, event attendance, and volunteer hours.
Click to Community Engagement KPI
How do I update the dashboard?
- Users can update the dashboard by:
- Entering actual engagement numbers in the Actual Numbers Input sheet.
- Updating target values in the Target Sheet tab.
- Adding previous year data in the Previous Year Numbers sheet.
Can I customize the dashboard for my organization?
- Yes! Since it’s built in Excel, you can:
- Modify KPI names, formulas, and target values.
- Customize charts and trend graphs to fit your organization’s needs.
- Add additional KPIs or data points.
What are some key KPIs to track in community engagement?
- Common community engagement KPIs include:
- Social Media Engagement (likes, shares, comments)
- Volunteer Hours Logged
- Event Attendance Rates
- Membership Growth
- Survey Response Rates
How often should I review the KPI Dashboard?
- It’s best to review and update the dashboard monthly to ensure real-time insights.
- Conduct a quarterly analysis to assess trends and make necessary adjustments.
Click to Community Engagement KPI
Visit our YouTube channel to learn step-by-step video tutorials