In the healthcare industry, particularly in emergency departments, it is crucial to keep track of various key performance indicators (KPIs) to ensure the best care and operational efficiency. Hospital Emergency KPI dashboards in Power BI offer healthcare professionals and administrators a centralized tool for monitoring and analyzing important data, which is critical for patient care, decision-making, and overall hospital performance.
In this article, we will explore the Hospital Emergency KPI Dashboard in Power BI, its key features, the benefits of using it, and best practices for effective usage.
What is a Hospital Emergency KPI Dashboard in Power BI?
A Hospital Emergency KPI Dashboard in Power BI is a dynamic, interactive tool designed to track and visualize the performance of emergency department operations. The dashboard is built using Power BI and data from an Excel file, making it easy for hospital staff to keep track of key performance metrics such as treatment times, patient outcomes, and departmental efficiency. By using real-time data and visualizations, the dashboard provides stakeholders with insights that can drive better decision-making, resource allocation, and patient care improvements.
Key Features of the Hospital Emergency KPI Dashboard
This Hospital Emergency KPI Dashboard in Power BI is a ready-to-use dashboard that helps track and measure various KPIs in the hospital emergency department. The dashboard is comprised of three key pages within the Power BI desktop application.
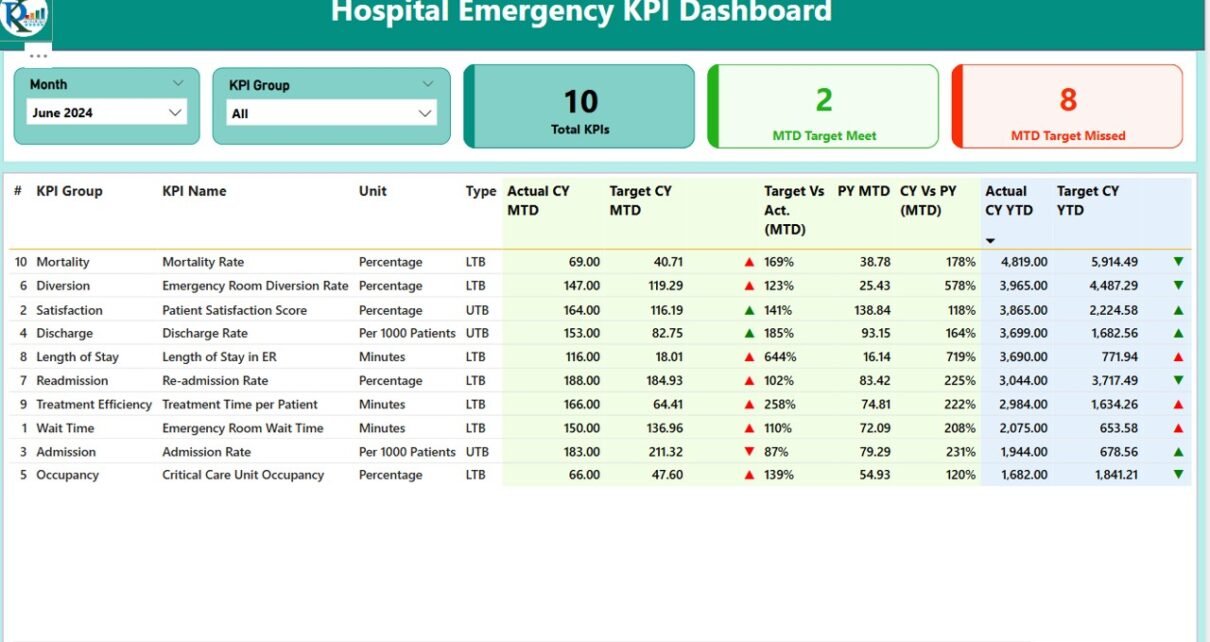
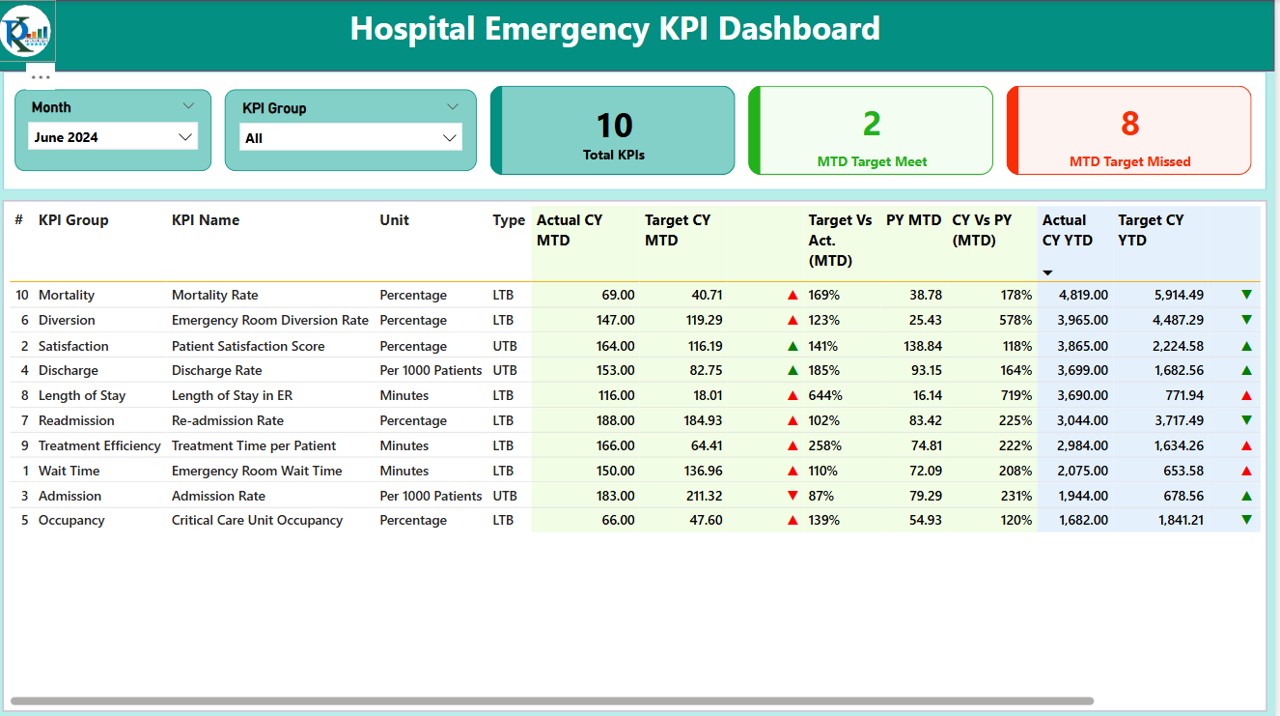
1. Summary Page: Overview of Key Metrics
The Summary Page is the main page of the dashboard, where hospital staff can quickly access an overview of the key metrics for the emergency department.
Key Features:
Month and KPI Group Slicer: Allows users to filter data based on specific months and KPI groups for a customized view.
KPIs Cards: This section includes three key performance cards:
- Total KPIs count
- MTD (Month-To-Date) Target Meet count
- MTD Target Missed count
Detailed KPI Table: Below the KPIs cards, a detailed table provides the following information:
- KPI Number: Sequence number of each KPI.
- KPI Group: The category to which the KPI belongs.
- KPI Name: The name of the KPI.
- Unit: Measurement unit for each KPI.
- Type: Indicates if the KPI is Lower-the-Better (LTB) or Upper-the-Better (UTB).
- Actual CY MTD: Actual values for the current year’s MTD.
- Target CY MTD: Target values for the current year’s MTD.
- MTD Icon: ▼ and ▲ icons indicate whether the KPI status is on track or not.
- Target Vs Act. (MTD): The percentage of actual vs. target values for MTD.
- PY MTD: MTD values from the previous year for comparison.
- CY Vs PY (MTD): A percentage comparison between the current year’s MTD and the previous year’s MTD.
- Actual CY YTD: Current year’s YTD actual data.
- Target CY YTD: Current year’s YTD target values.
- YTD Icon: ▼ and ▲ icons for YTD KPI status.
- Target Vs Act. (YTD): The percentage of actual vs. target values for YTD.
- PY YTD: YTD values for the same period from the previous year.
- CY Vs PY (YTD): A percentage comparison between the current year’s YTD and the previous year’s YTD.
Click to buy Hospital Emergency KPI Dashboard in Power BI
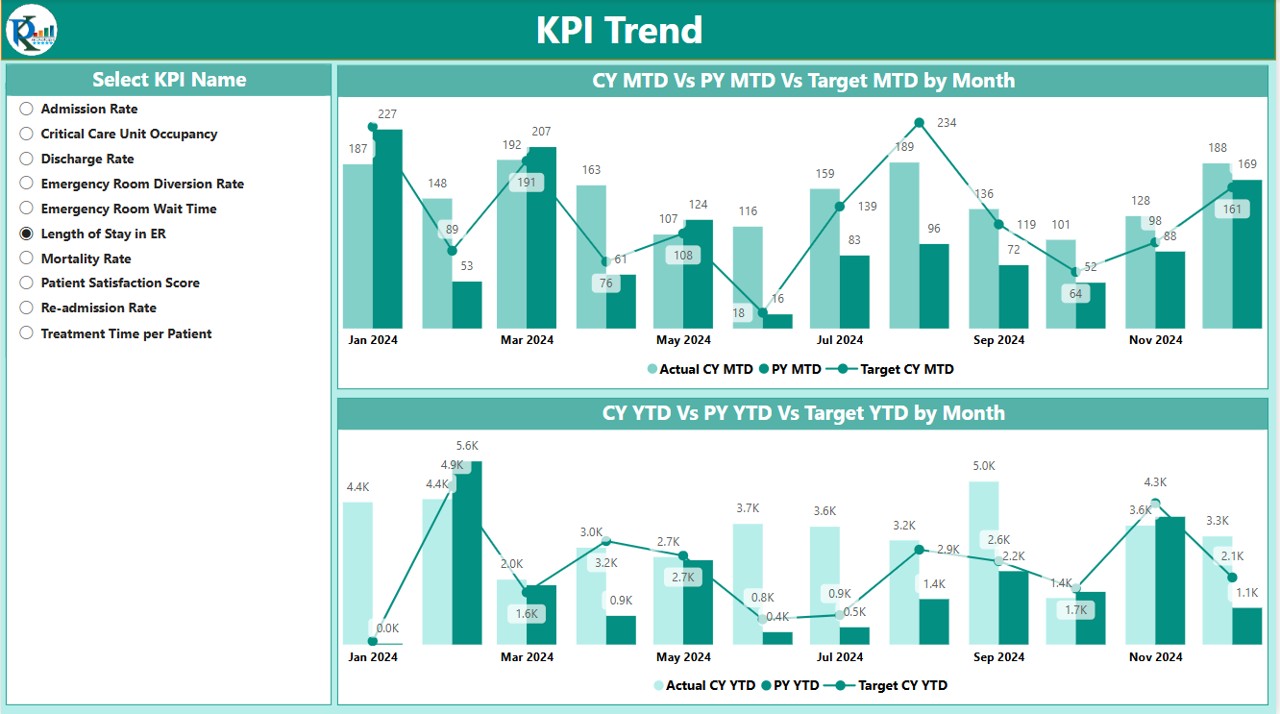
2. KPI Trend Page: Visualizing Trends Over Time
The KPI Trend Page displays two combo charts that track the actual numbers for the current year, previous year, and targets for both MTD and YTD.
Key Features:
- Combo Charts: These charts show the trend of KPIs over time, helping to visualize the performance comparison across years.
- KPI Name Slicer: Users can select specific KPIs from a slicer to filter the data and trends according to their needs.
Click to buy Hospital Emergency KPI Dashboard in Power BI
The KPI Definition Page is a drill-through page where users can access detailed information about each KPI.

Click to buy Hospital Emergency KPI Dashboard in Power BI
Key Features:
- Formula and Definition: Users can drill through from the summary page to view the formula and detailed definition of each KPI.
- Back Button: A back button is available at the top-left corner of the page for easy navigation back to the summary page.
Excel Data Structure for the Hospital Emergency KPI Dashboard
The data source for this Power BI dashboard is an Excel file that includes three important worksheets:
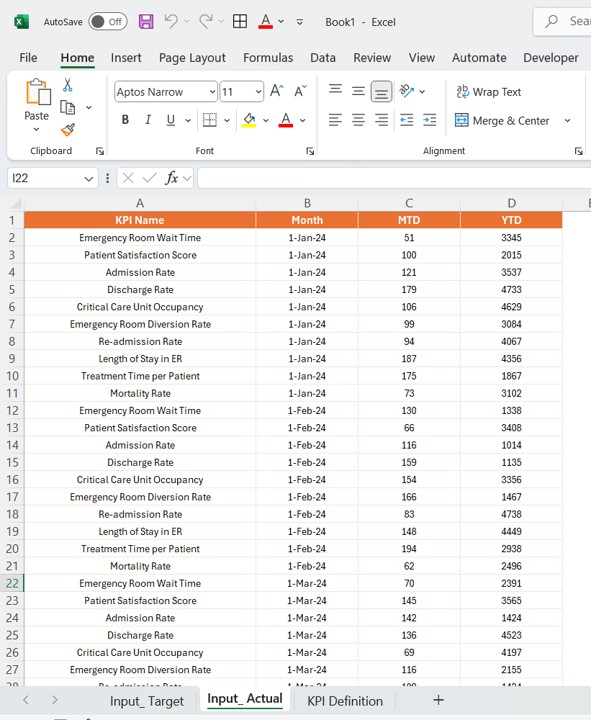
1. Input_Actual Sheet Tab
In this sheet, hospital staff need to input the actual KPI numbers for each KPI name, month (using the first date of the month), MTD, and YTD values.
Click to buy Hospital Emergency KPI Dashboard in Power BI
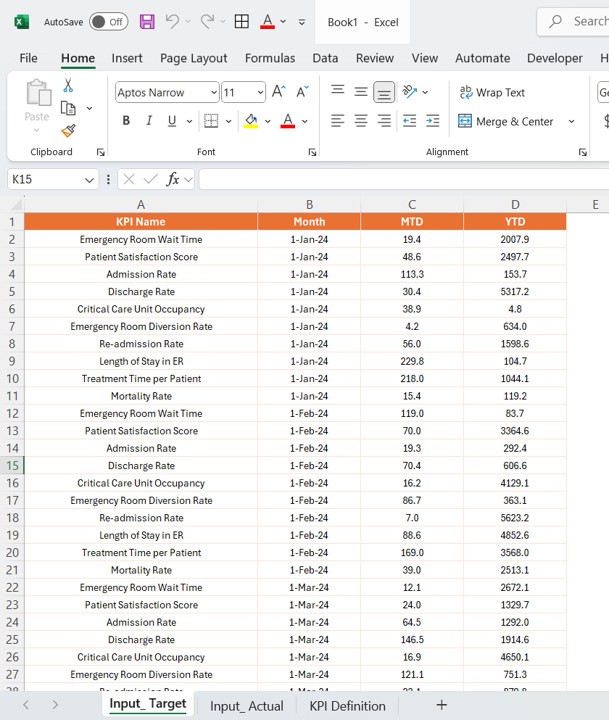
2. Input_Target Sheet Tab
Here, the target values for each KPI name, month, MTD, and YTD are entered.
Click to buy Hospital Emergency KPI Dashboard in Power BI
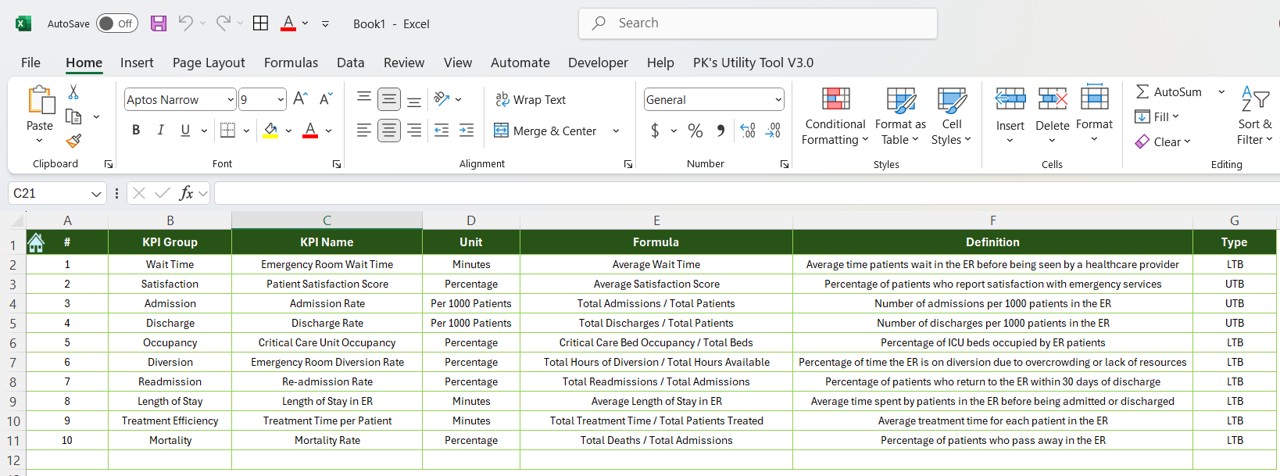
3. KPI Definition Sheet
This sheet contains essential information about each KPI:
- KPI Number: Sequence number of the KPI.
- KPI Group: Category or group of the KPI.
- KPI Name: Name of the KPI.
- Unit: Unit of measurement for the KPI.
- Formula: The formula used to calculate the KPI.
- Definition: A detailed definition of the KPI.
- Type: Indicates whether the KPI is Lower-the-Better (LTB) or Upper-the-Better (UTB).
Click to buy Hospital Emergency KPI Dashboard in Power BI
Advantages of Using a Hospital Emergency KPI Dashboard
Implementing a Hospital Emergency KPI Dashboard in Power BI provides numerous benefits that can significantly improve the efficiency and effectiveness of emergency department operations.
- Centralized Data Access: The dashboard consolidates all essential data in one location, making it easier for hospital staff to access and analyze real-time information. By centralizing data, stakeholders can save time and reduce errors associated with multiple data sources.
- Improved Decision Making: With up-to-date visualizations and performance trends, decision-makers can quickly spot areas needing attention and make informed decisions to improve patient care and hospital operations.
- Enhanced Monitoring and Reporting: Using KPIs allows for easy monitoring of departmental performance. The dashboard’s visual representation of data enables stakeholders to track performance over time, identify trends, and generate reports quickly.
- Real-Time Performance Tracking: By continuously updating the dashboard with live data, hospital management can monitor performance in real time, enabling them to address issues promptly and make timely adjustments to improve operations.
- Actionable Insights: The visual elements of the dashboard (such as trends, comparisons, and icons) provide actionable insights that can lead to targeted improvements in performance. For example, if a KPI is trending poorly, hospital management can address the root cause before it becomes a larger problem.
Opportunities for Improvement in the Hospital Emergency KPI Dashboard
While the Hospital Emergency KPI Dashboard is powerful, there are always opportunities for improvement and added functionality.
- Integration with Other Systems: Integrating the dashboard with other hospital management systems (such as Electronic Health Records or Patient Management Systems) would allow for more seamless data updates and cross-platform analysis.
- Mobile Accessibility: Offering a mobile version of the dashboard could give emergency department staff and management access to key performance indicators while on the go, ensuring that decisions can be made quickly in real-time.
- Enhanced Alerting and Notification System: Implementing automated alerts for underperforming KPIs would help staff address issues as soon as they arise. This feature could be linked to performance thresholds, ensuring that stakeholders are notified immediately if a KPI falls below acceptable levels.
- Predictive Analytics: Incorporating predictive analytics into the dashboard could help forecast future trends and performance, allowing hospital management to take proactive measures to address issues before they occur.
Best Practices for Using the Hospital Emergency KPI Dashboard
To maximize the effectiveness of the Hospital Emergency KPI Dashboard in Power BI, it’s important to follow some best practices for data entry, interpretation, and reporting.
- Regular Data Updates: Ensure that the Excel data is updated regularly with accurate information. Missing or outdated data can lead to inaccurate insights and decisions.
- Customize for Specific Needs: Tailor the dashboard to focus on the KPIs most relevant to your hospital’s operations. Not all KPIs will be important to every department, so it’s important to customize the dashboard to meet the specific needs of your team.
- Training and Education: Ensure that all stakeholders, from emergency department staff to hospital executives, are trained on how to interpret and use the dashboard. This will maximize its impact and encourage adoption across the organization.
- Regular Performance Reviews: Schedule regular performance review meetings to go over the KPIs displayed on the dashboard. This ensures that everyone is aligned on the hospital’s goals and performance objectives.
Conclusion
The Hospital Emergency KPI Dashboard in Power BI is a comprehensive tool for improving emergency department operations. By centralizing data, tracking key performance indicators, and offering real-time insights, the dashboard helps hospital staff and management monitor their performance and make data-driven decisions to improve patient care. With opportunities for integration, mobile access, and predictive analytics, this dashboard has the potential to evolve and provide even more value for hospital operations.
Frequently Asked Questions (FAQ)
What KPIs are included in the Hospital Emergency KPI Dashboard?
The dashboard includes various KPIs related to the performance of the emergency department, including treatment times, patient outcomes, and operational efficiency. Specific KPIs include MTD (Month-to-Date) and YTD (Year-to-Date) values.
Can the dashboard be customized for different hospitals?
Yes, the dashboard can be customized to meet the specific needs of different hospitals. KPIs can be adjusted based on the hospital’s goals, and the dashboard can be tailored to focus on specific areas of performance.
How often should the data in the Excel file be updated?
The data should be updated regularly to ensure the accuracy of the dashboard. It is recommended to update the data at least once a week to maintain real-time tracking.
Can the dashboard be accessed on mobile devices?
Currently, the dashboard is designed for desktop use within Power BI. However, it could be made accessible on mobile devices by implementing Power BI’s mobile app or creating a mobile-friendly version.
What are the benefits of using the Hospital Emergency KPI Dashboard?
The key benefits include centralized data access, real-time performance tracking, enhanced decision-making, and the ability to identify trends and areas for improvement quickly.
Visit our YouTube channel to learn step-by-step video tutorials
Watch the step-by-step video Demo:
Click to buy Hospital Emergency KPI Dashboard in Power BI