In today’s fast-paced manufacturing world, keeping projects on track and aligned with key performance indicators (KPIs) is more important than ever. Whether you’re a project manager, operations lead, or plant supervisor, having access to real-time data helps you make informed decisions. That’s exactly where the Manufacturing Project Timeline KPI Dashboard in Excel comes in handy.
This powerful, easy-to-use Excel template brings all your project and KPI data together in one place, offering clear visuals, flexible analysis, and actionable insights.
What Is a Manufacturing Project Timeline KPI Dashboard?
A Manufacturing Project Timeline KPI Dashboard is an Excel-based tool designed to track key metrics, timelines, and performance indicators across manufacturing projects. It visually displays actual performance against targets and past benchmarks, helping teams stay focused, efficient, and on schedule.
This dashboard not only simplifies your reporting process but also enhances your ability to monitor project progress over time. With a few clicks, you can compare actual metrics to both targets and previous year data, identify trends, and act quickly on any red flags.
Click to Purchase Manufacturing Project Timeline KPI Dashboard in Excel
Key Features of the Manufacturing KPI Dashboard in Excel
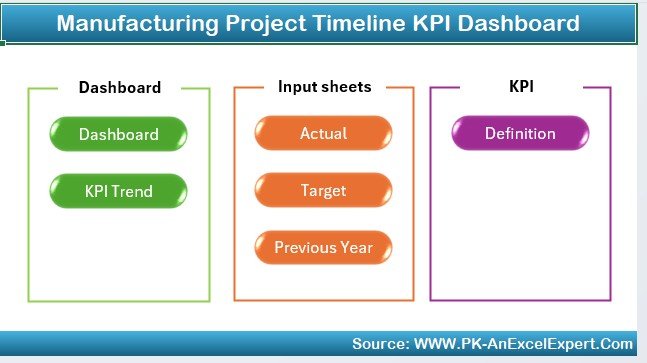
This template is built with 7 fully functional worksheets that are interconnected to automate tracking, reporting, and visualization:
Home Sheet
- Acts as the index page.
- Contains 6 clickable buttons to navigate directly to other sheets.
- Makes navigation seamless and fast.
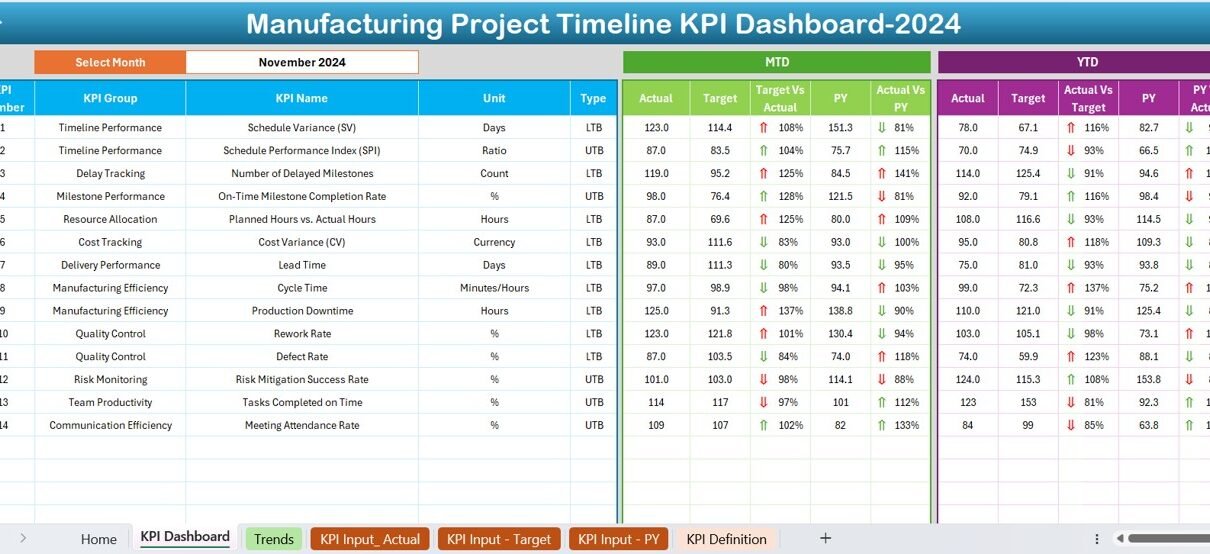
Dashboard Sheet
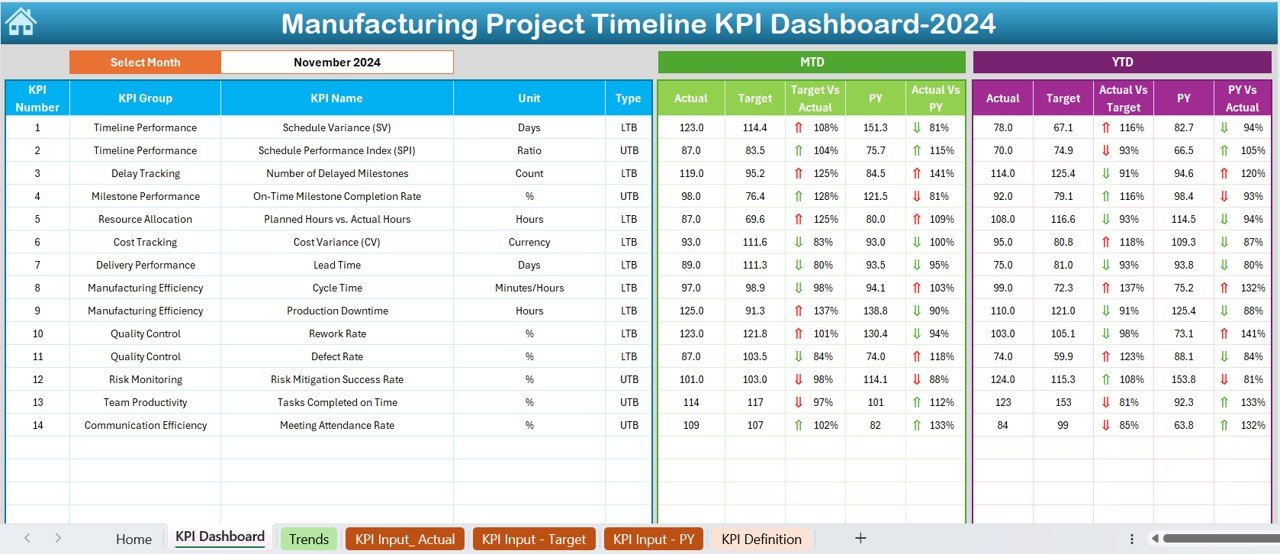
The core of this tool.
- Use the dropdown in cell D3 to select any month.
- Dashboard updates dynamically to show:
- MTD Actual, Target, and Previous Year values.
- YTD Actual, Target, and Previous Year values.
- Conditional Formatting with up/down arrows to indicate progress.
- Allows quick performance reviews for both short-term (MTD) and long-term (YTD) analysis.
KPI Trend Sheet
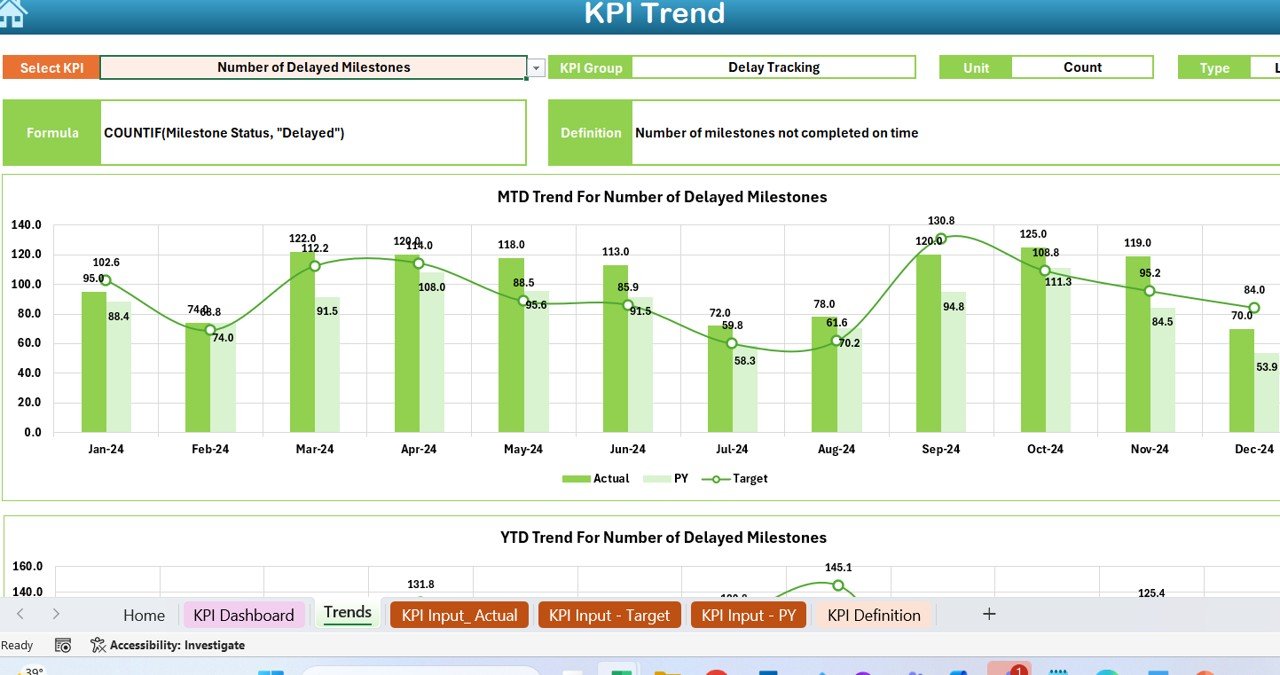
- Lets you analyze trends for any KPI.
- Choose KPI from dropdown in C3.
Displays:
Click to Purchase Manufacturing Project Timeline KPI Dashboard in Excel
- KPI Group, Unit, Type (Upper or Lower is Better)
- KPI Formula and Definition
- Trend Charts for MTD and YTD
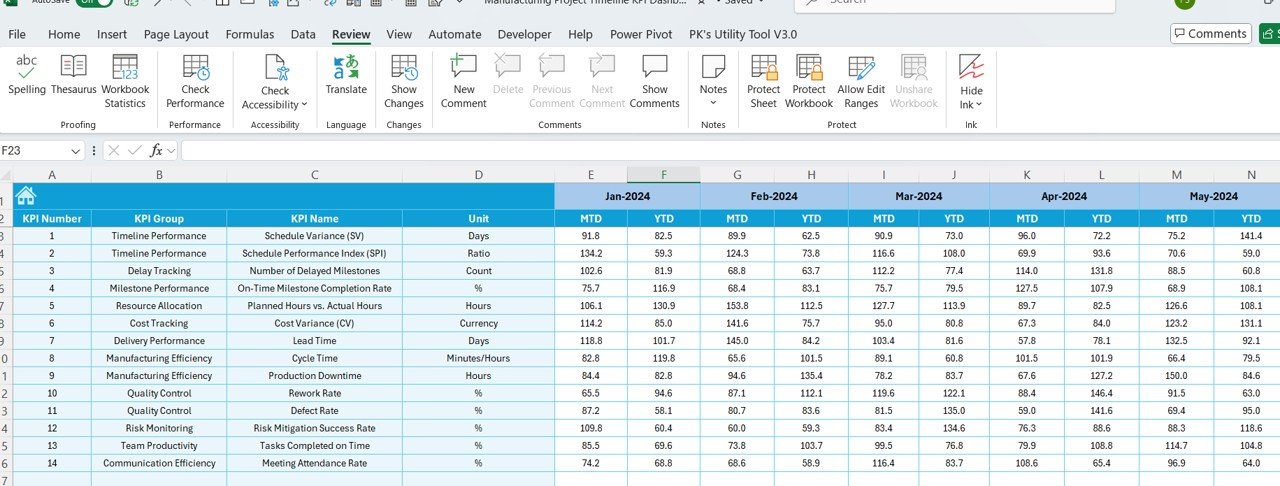
Actual Numbers Input Sheet
- Where you enter real performance data for each KPI.
- Select your reporting start month using cell E1.
- Input both MTD and YTD data for accurate tracking.
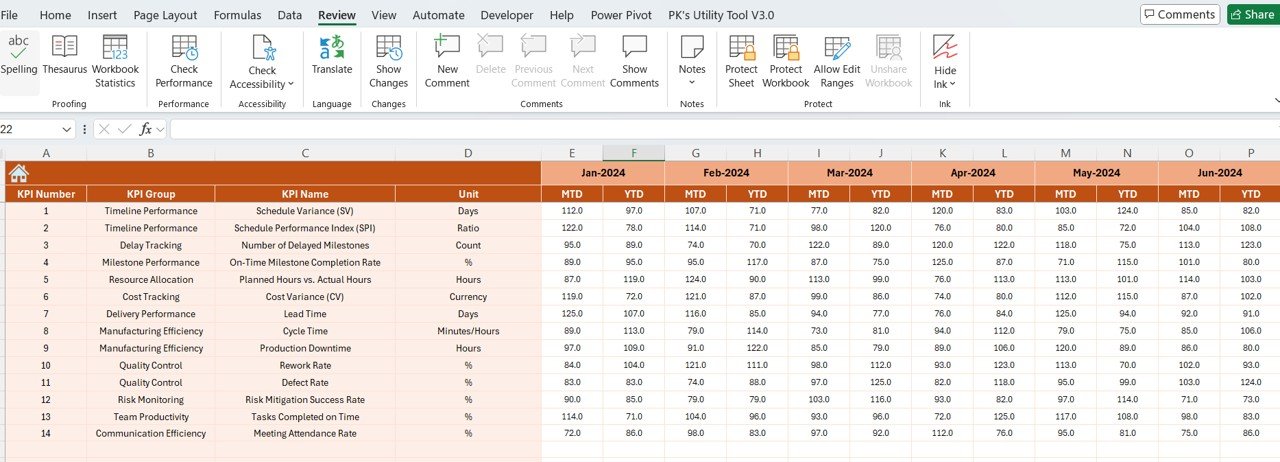
Target Sheet
- Enter your planned numbers for each KPI.
- Input values for both MTD and YTD.
- Lays the foundation for comparing actual performance to set targets.
Previous Year Data Sheet
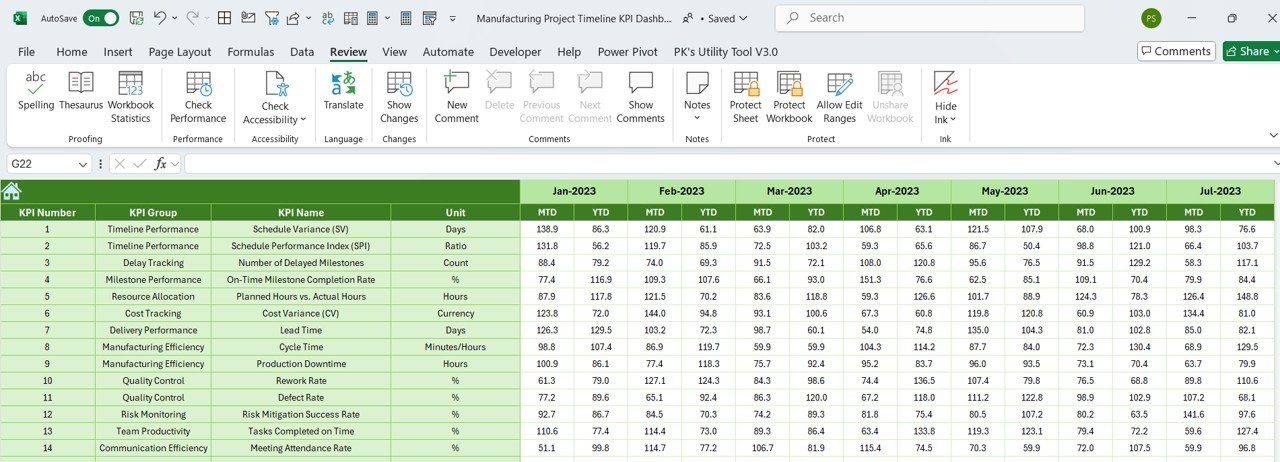
- Holds last year’s KPI numbers.
- Critical for YOY comparisons and identifying growth patterns.
KPI Definition Sheet
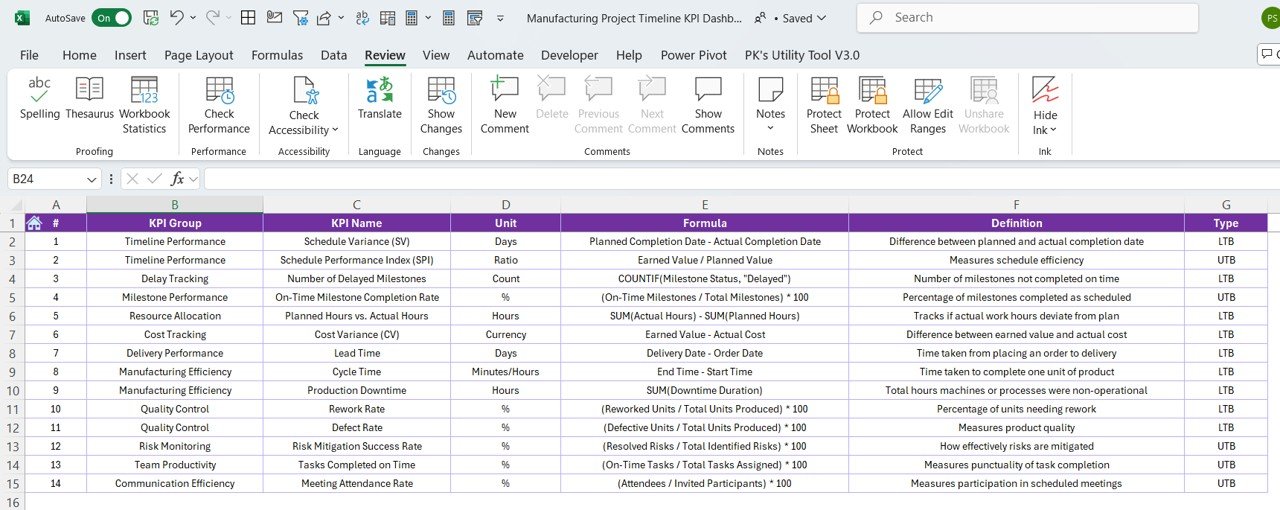
A master reference sheet.
Includes:
- KPI Name, Group, Unit
- KPI Formula
- A clear and simple KPI definition
Advantages of Using a Manufacturing Project Timeline KPI Dashboard
Let’s look at the top reasons why this dashboard can transform your project tracking process:
✅ Improved Visibility: Everything from actuals to targets is visualized.
✅ Instant Comparisons: View performance vs. target and previous year at a glance.
✅ Time Efficiency: Save hours by using the drop-downs and auto-updating charts.
✅ Better Decisions: Quickly identify underperforming KPIs.
✅ Customizable: Modify KPIs or formats based on your specific project needs.
Best Practices for Using the Manufacturing KPI Dashboard
To make the most of your Excel dashboard, follow these tried-and-true best practices:
- Set Clear KPI Targets Early: Before your project kicks off, define the monthly and yearly targets for each KPI.
- Update Data Regularly: Keep your Actual Numbers and Targets sheets up to date to reflect real-time status.
- Use the Trend Sheet Often: Analyze KPI behavior over time to catch patterns, especially for cost, quality, and timeline metrics.
- Train Your Team: Make sure your team understands how to navigate the dashboard and interpret charts and indicators.
- Review Monthly: Hold monthly meetings using the Dashboard Sheet to discuss metrics and take action as needed.
Conclusion
The Manufacturing Project Timeline KPI Dashboard in Excel gives you the power to monitor, evaluate, and improve project performance with confidence. It centralizes your data, saves you time, and brings transparency to your manufacturing process.
Frequently Asked Questions (FAQs)
🔍 What is the main purpose of the Manufacturing KPI Dashboard?
The dashboard helps track and visualize manufacturing KPIs over time, comparing actuals against targets and previous year’s data.
📅 Can I track monthly and yearly KPIs in this dashboard?
Yes. It includes MTD (Month-to-Date) and YTD (Year-to-Date) data views for better analysis.
🧵 Is the template customizable?
Absolutely! You can modify KPIs, chart types, and formulas as per your project’s requirements.
💡 Do I need advanced Excel skills to use this dashboard?
Not at all. Basic Excel knowledge is enough. The template is user-friendly and includes dropdowns for ease of use.
📆 How often should I update the dashboard?
Ideally, you should update the Actual and Target sheets at least once a month to keep it relevant.
Click to Purchase Manufacturing Project Timeline KPI Dashboard in Excel
Visit our YouTube channel to learn step-by-step video tutorials